Tulsa Dent Repair
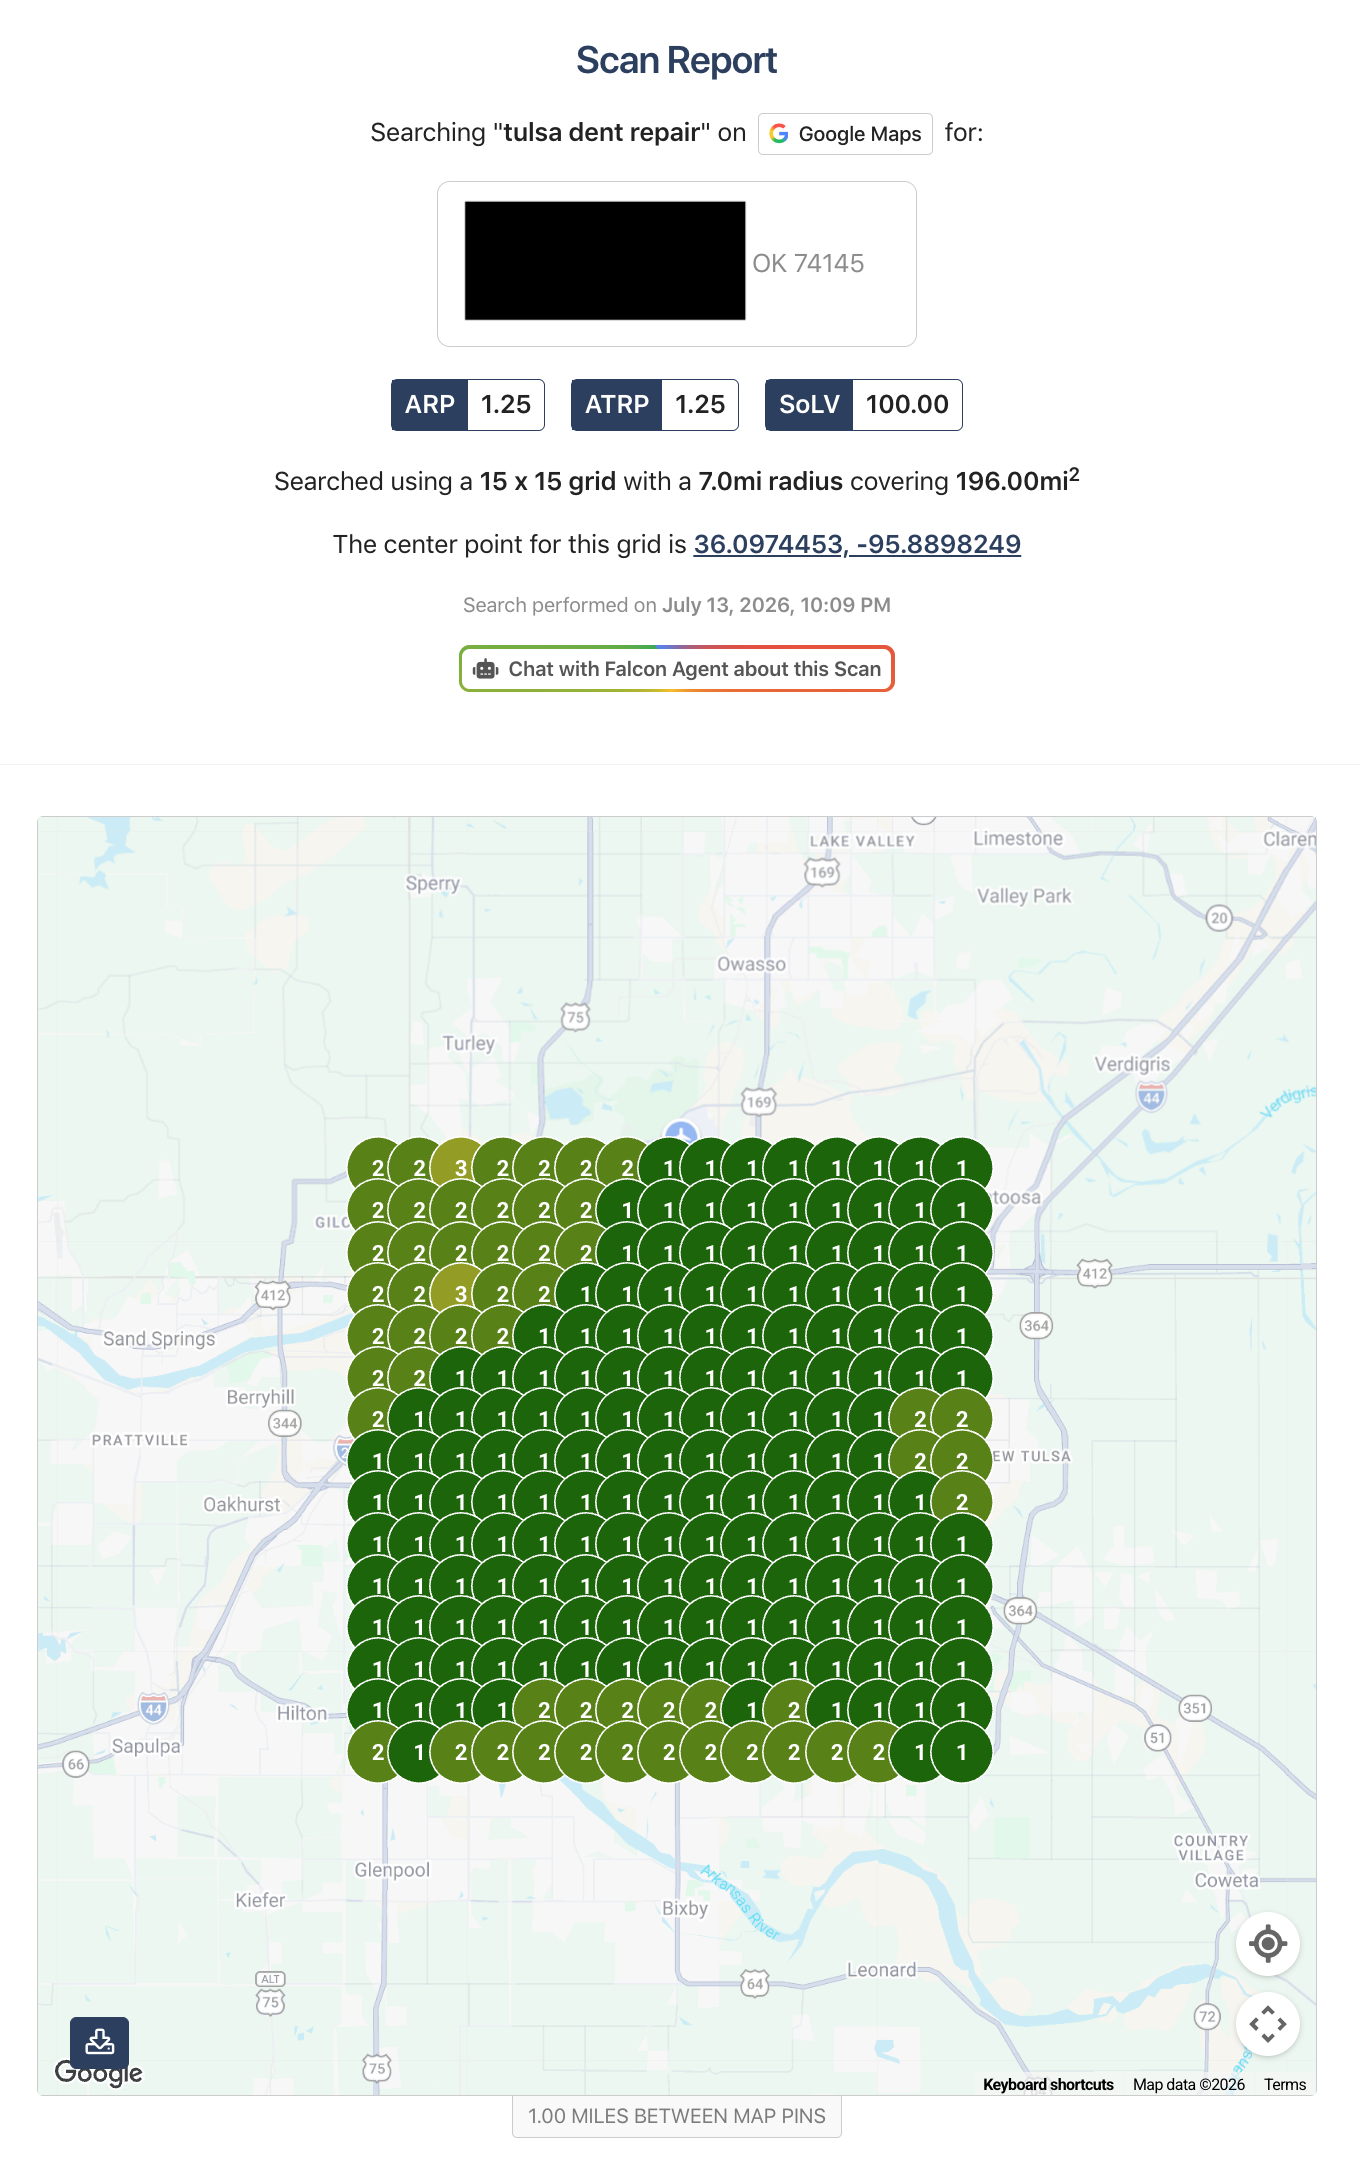
The strongest close-match keyword in the original report. The scan shows broad top-three visibility across the tested market, with the business appearing primarily in positions 1 and 2.
This case study uses a real, anonymized report from a dent repair business in Tulsa, Oklahoma to show two sides of local lead generation in one place: Google Business Profile visibility across four large local search grids and Google Ads performance from the same client account. The original client-facing reporting comes first, followed by a deeper agency breakdown of what the data means, how Local SEO with HighLevel fits into the picture, and how simple visual proof can strengthen client retention and new sales.
A consolidated look at Google Business Profile search visibility and paid-search performance for an anonymous Tulsa-area dent repair business. The public version keeps the useful performance data while removing client-identifying and account-specific information.
These are four separate keyword scans—not before-and-after comparisons. Each report tests how the anonymous business appears in Google's local map results from many locations across a broad Tulsa-area search grid.
The strongest close-match keyword in the original report. The scan shows broad top-three visibility across the tested market, with the business appearing primarily in positions 1 and 2.
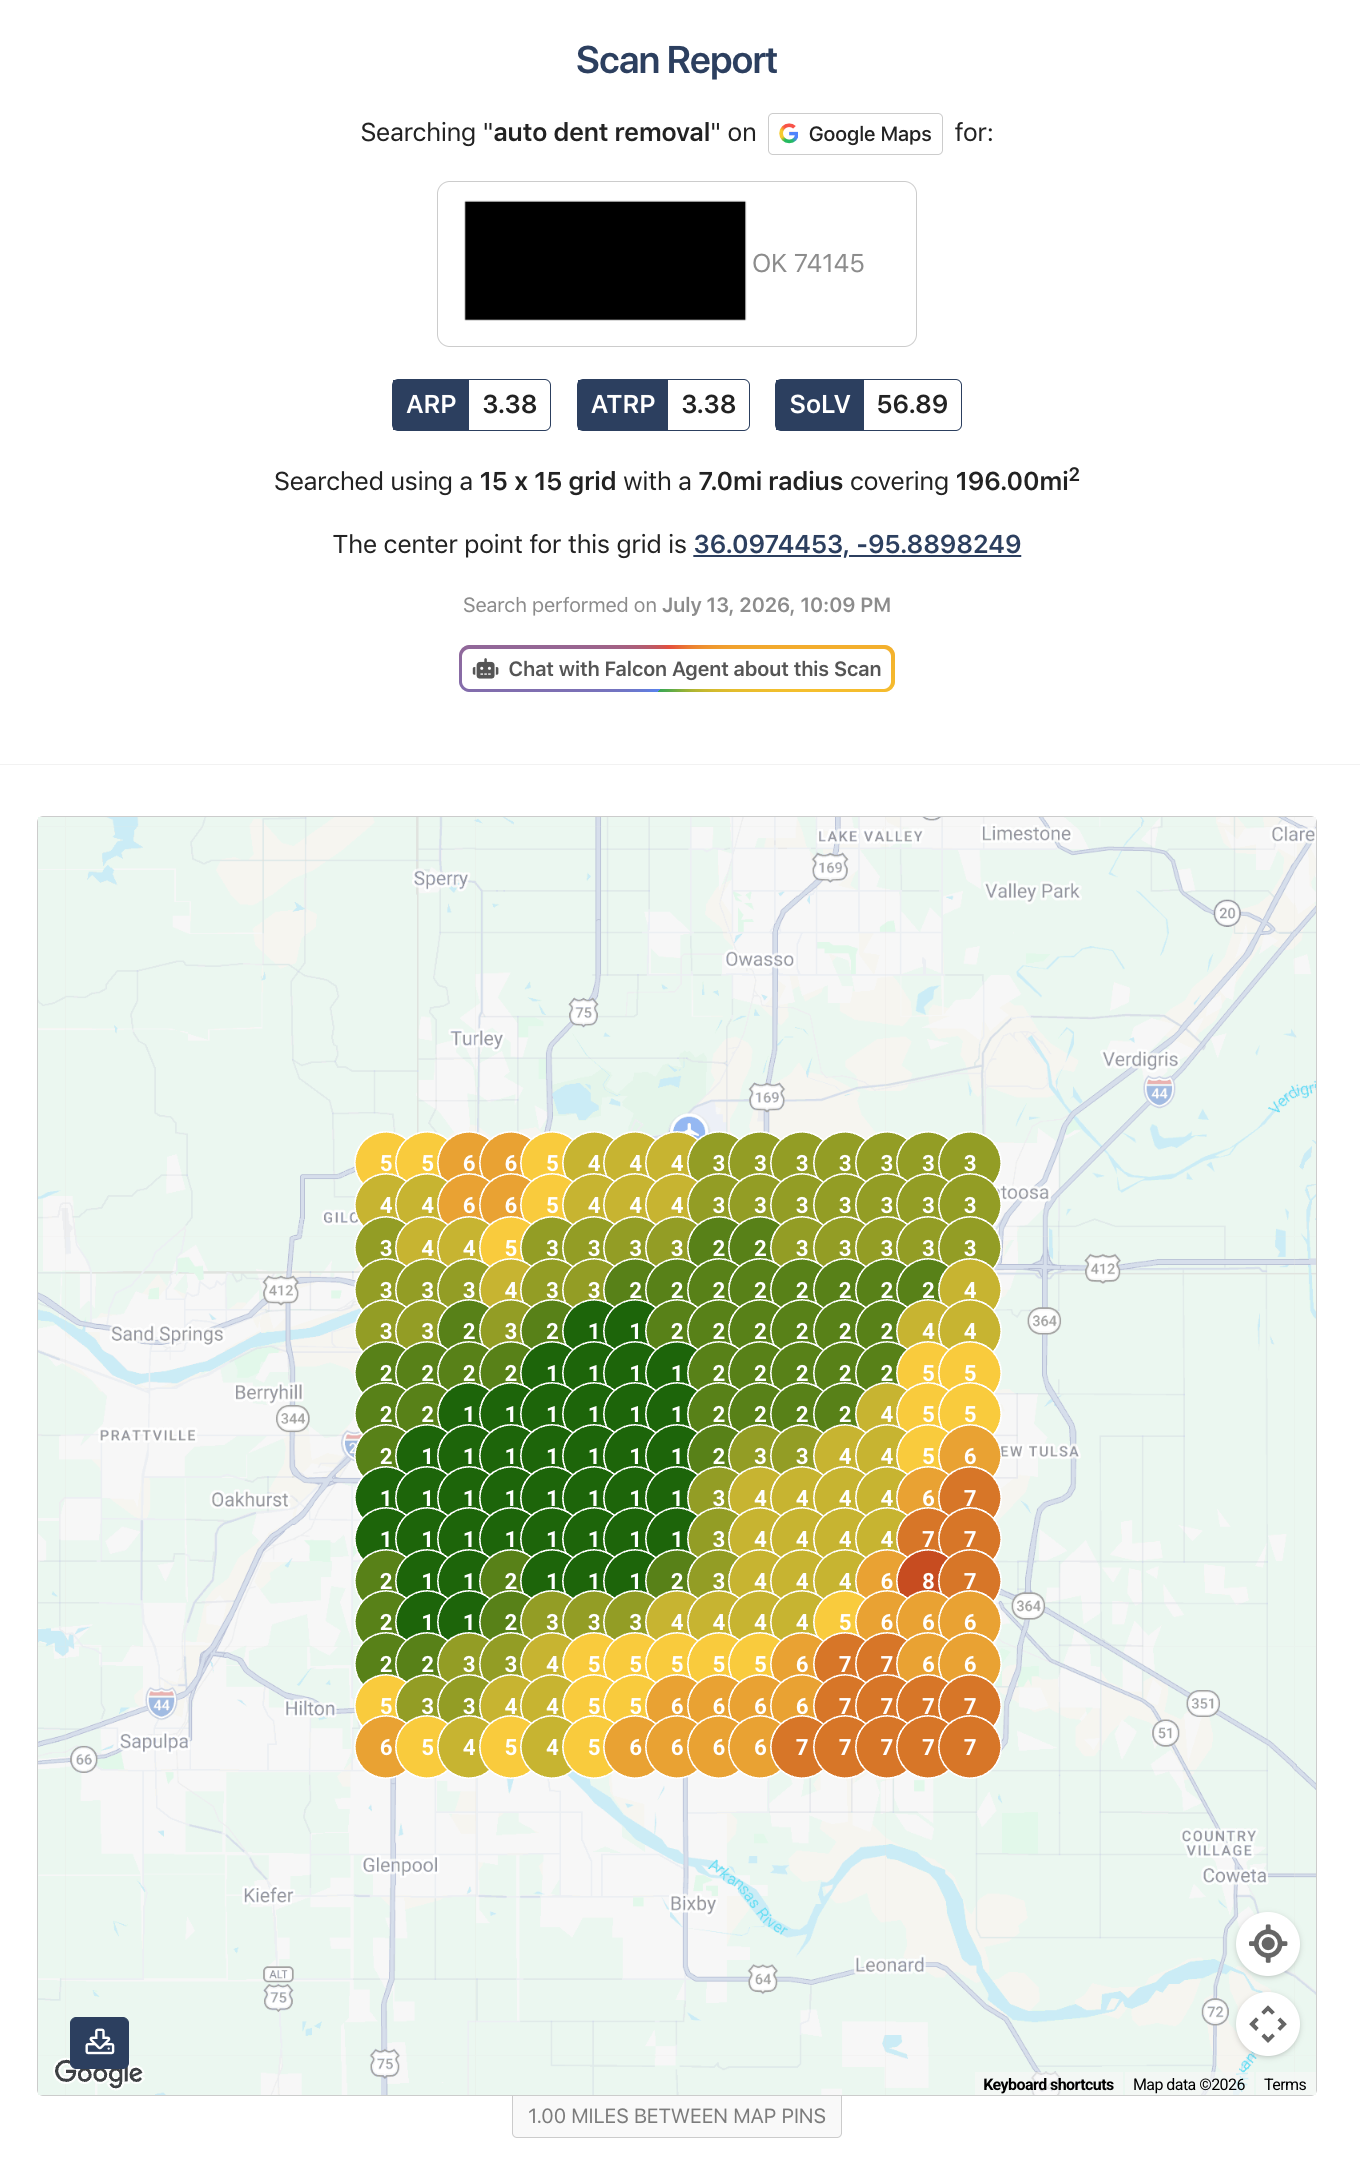
A competitive service-intent keyword. The original report showed the strongest visibility close to the business and through the central search corridor, with room to expand more top-three coverage outward.
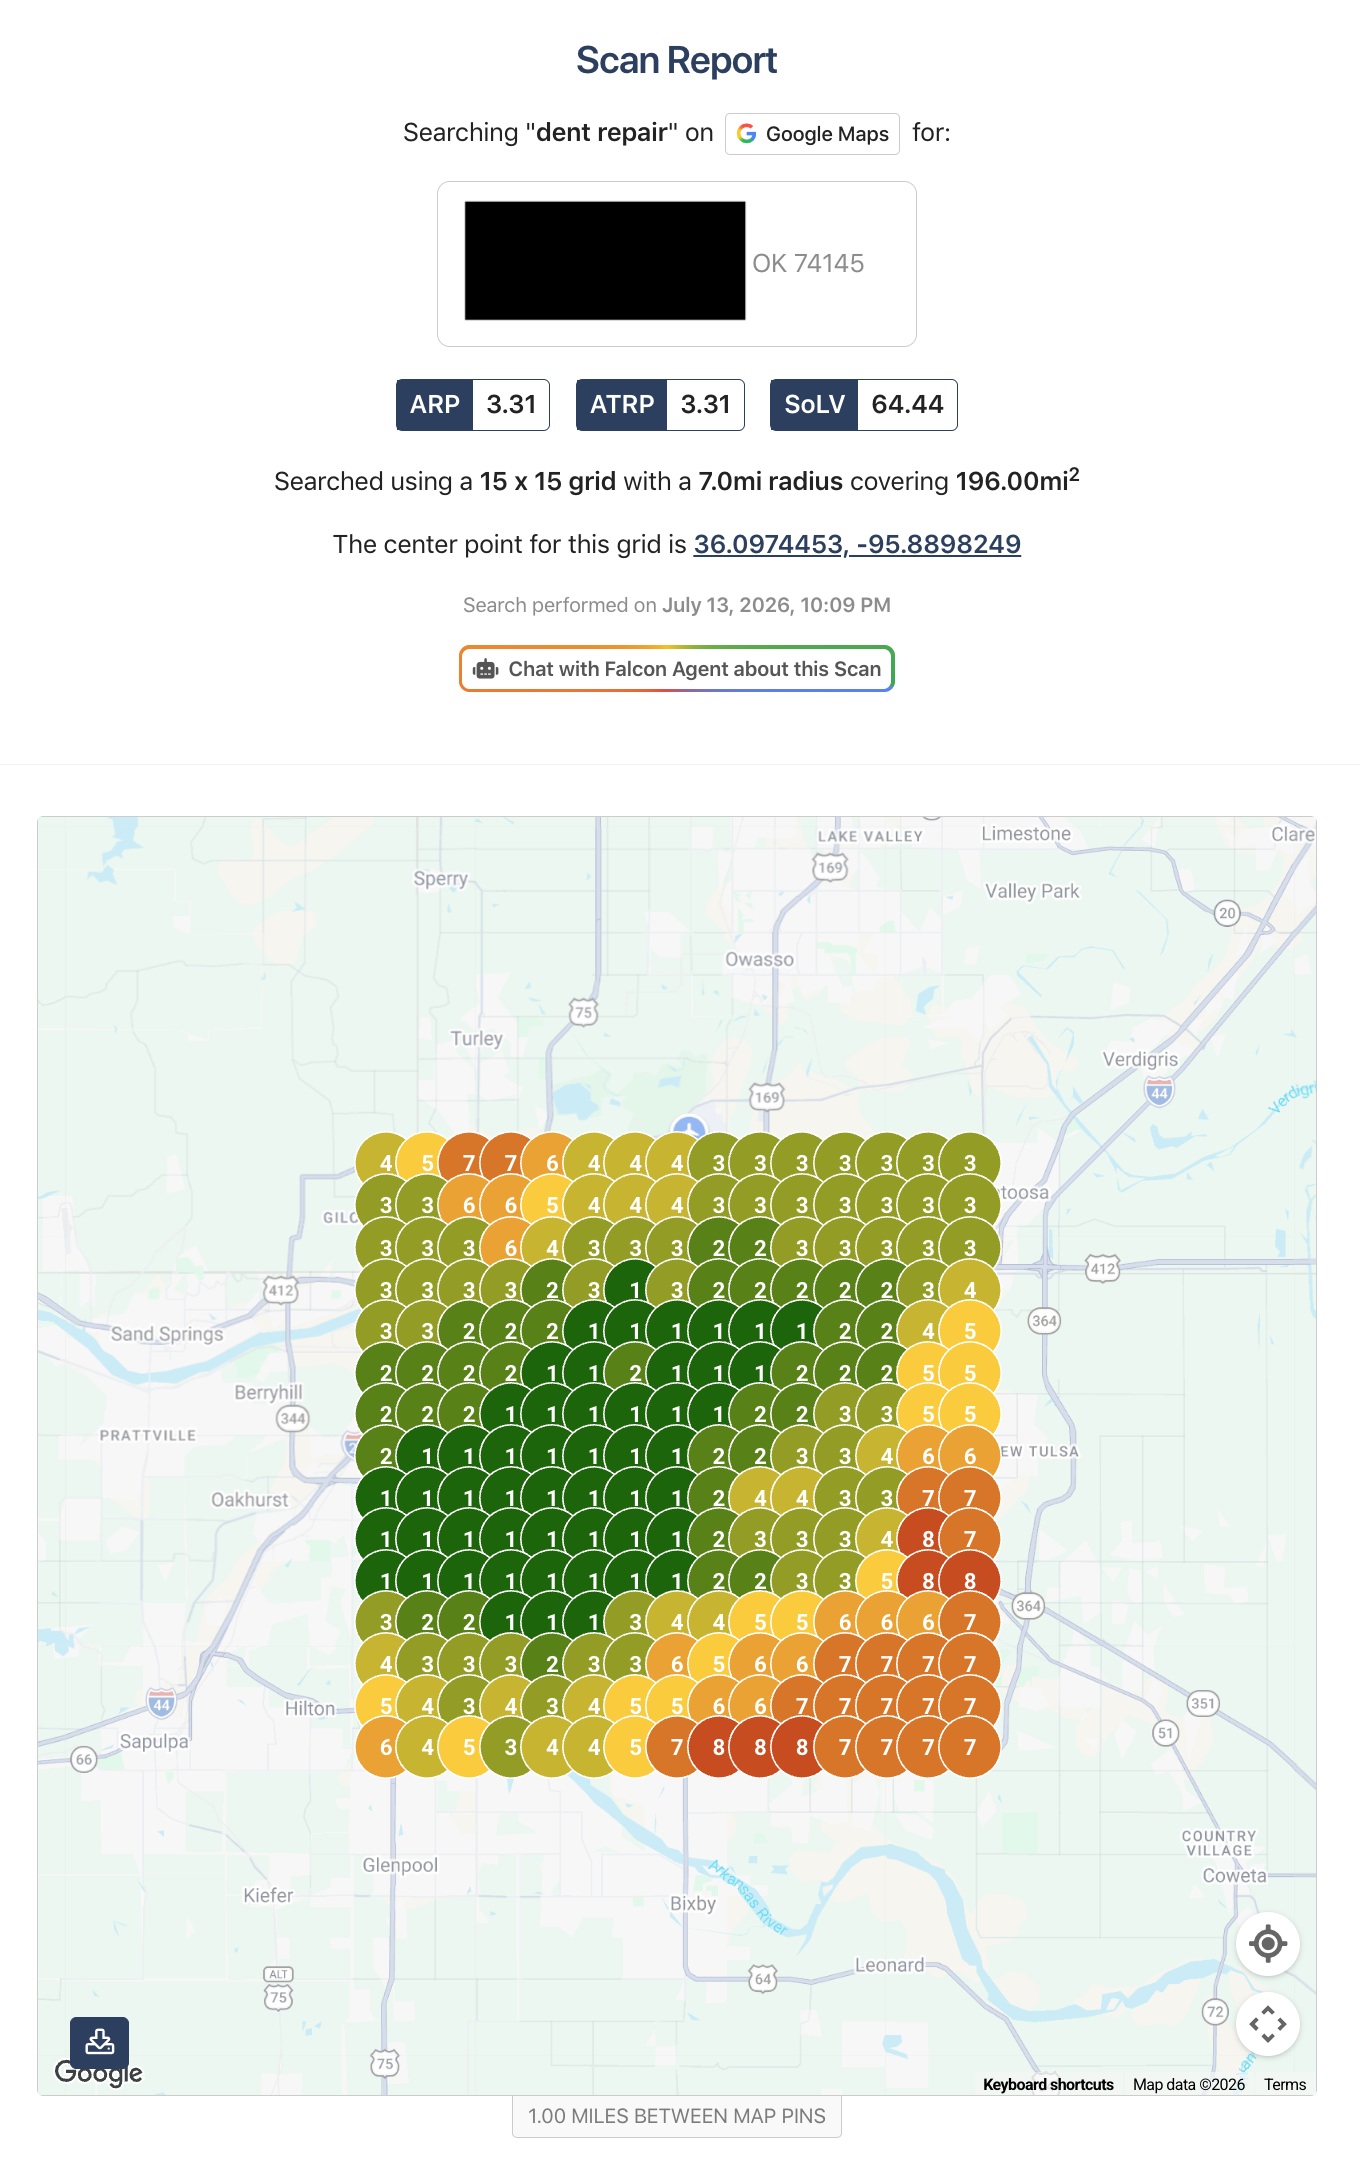
A broader competitive service keyword. The original report showed stronger visibility nearest the business, with additional geographic growth available as the search points move farther into the surrounding market.
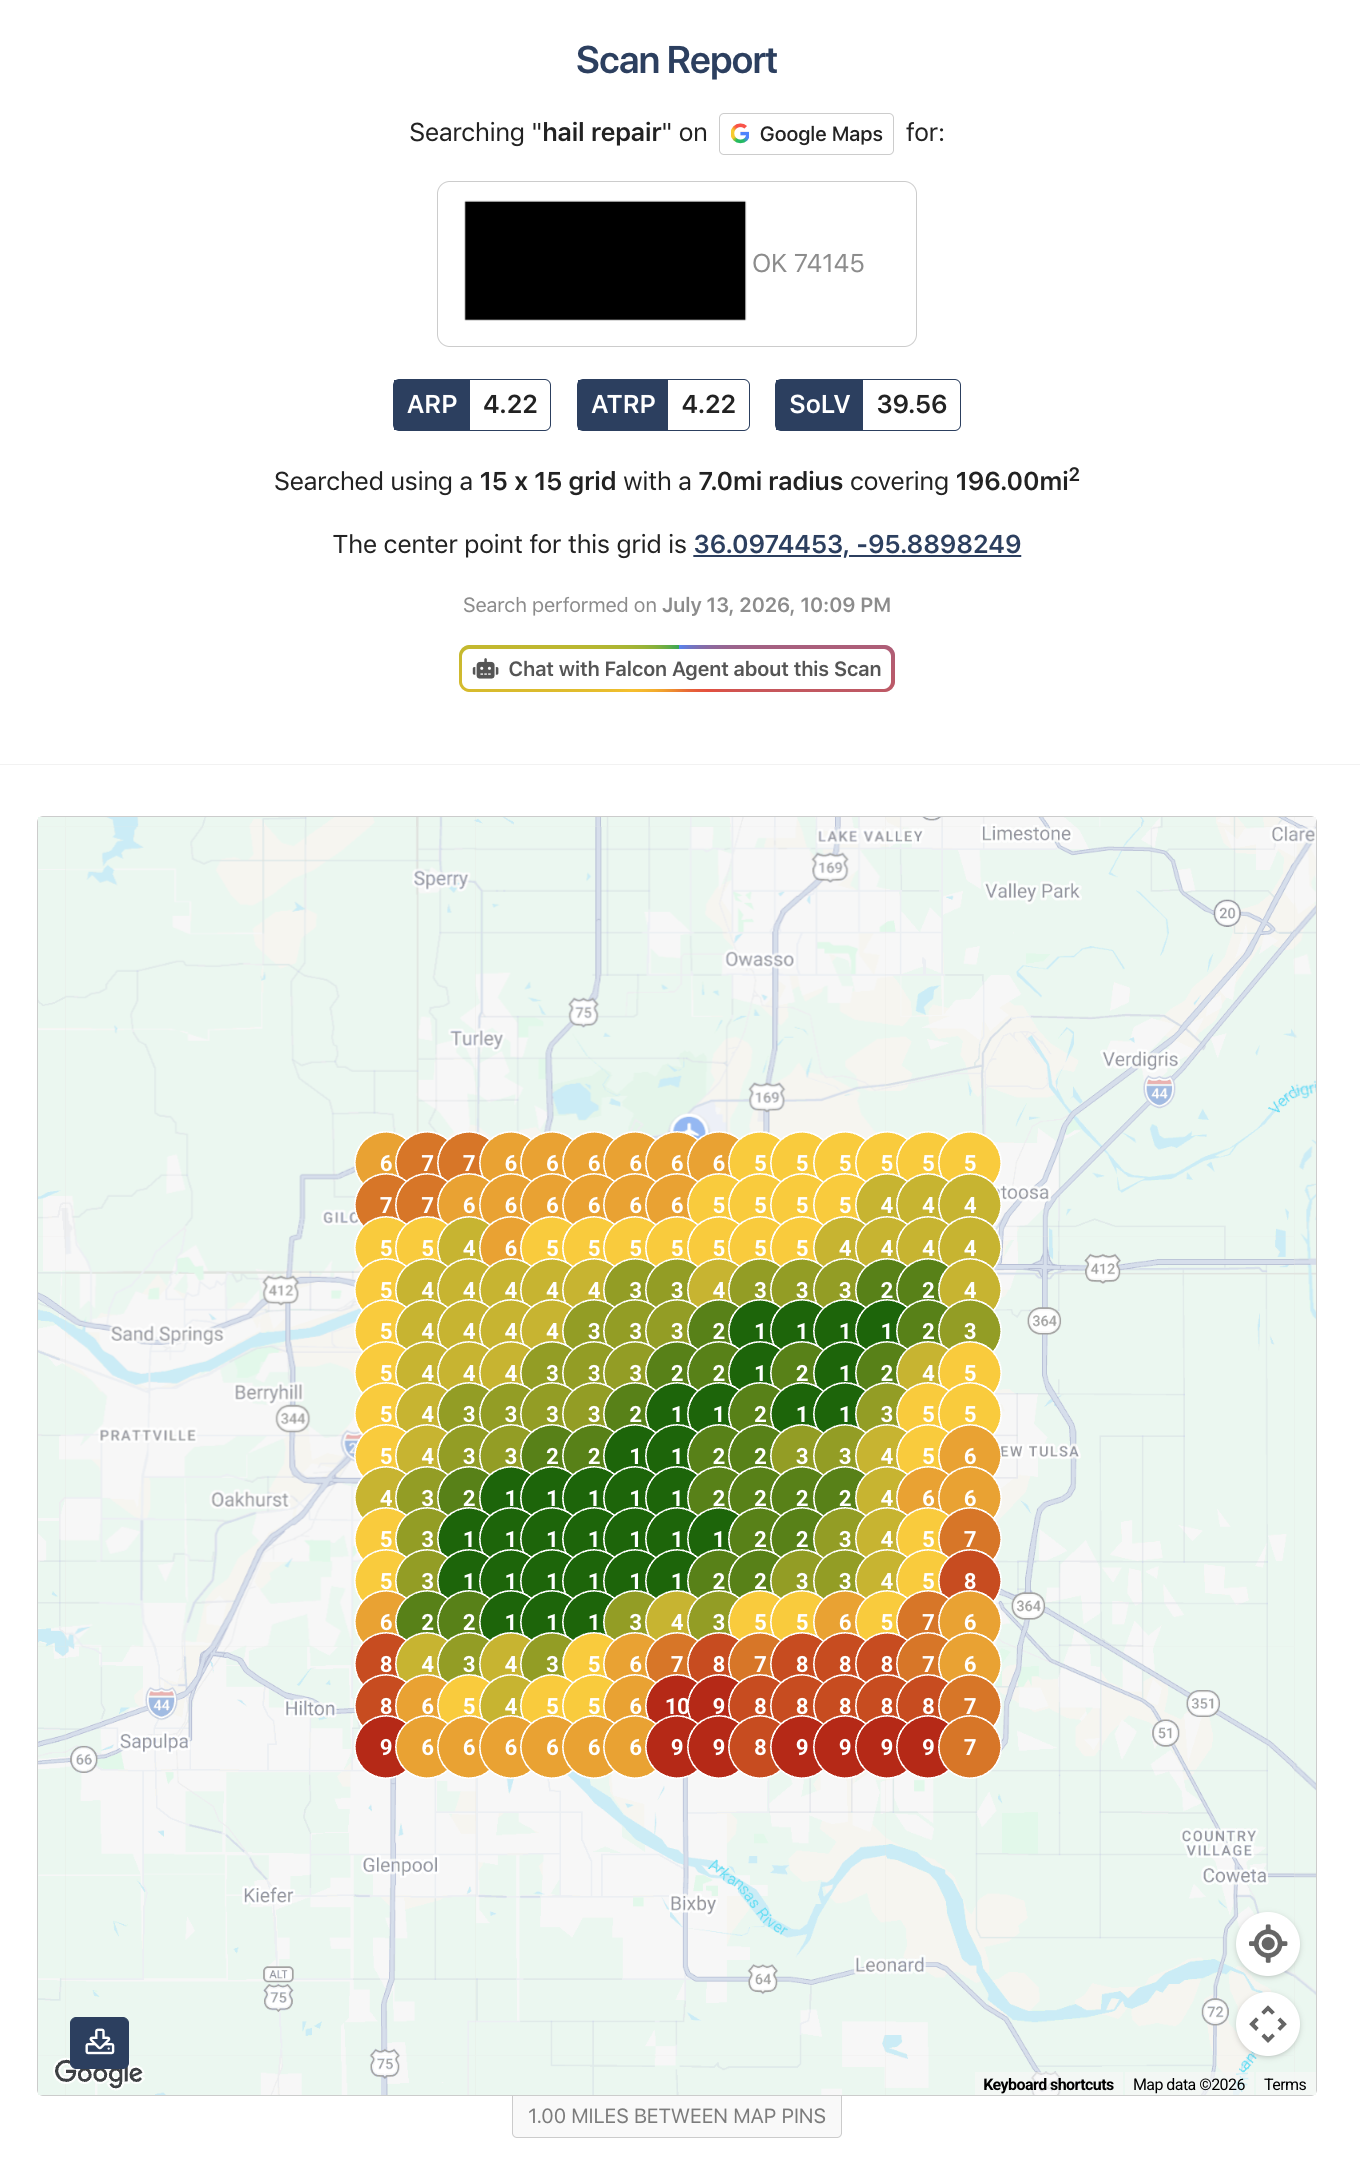
A high-value seasonal service keyword. This scan provides a geographic benchmark for a search category where demand and local competition can change quickly after weather events.
Every numbered dot represents a Google search performed from that exact location on the map for the listed keyword.
Search grids measure where an anonymous business appears in Google's local map results from many different locations instead of checking a ranking from only one address.
A larger geographic grid tests visibility farther away from the business, where proximity and a different set of competitors can influence the result. The 7-mile radius used here creates a 14-mile-wide market view rather than measuring only the immediate blocks around the business.
Each screenshot uses a different keyword. The purpose is to compare the business's geographic visibility across different service searches—not to claim that one grid improved over another. Keyword competition, search intent, and Google's local relevance signals can differ substantially from one query to the next.
Google local results can change block by block because proximity, relevance, prominence, reviews, website signals, business information, and nearby competitors can all influence which businesses appear for a search from a particular location.
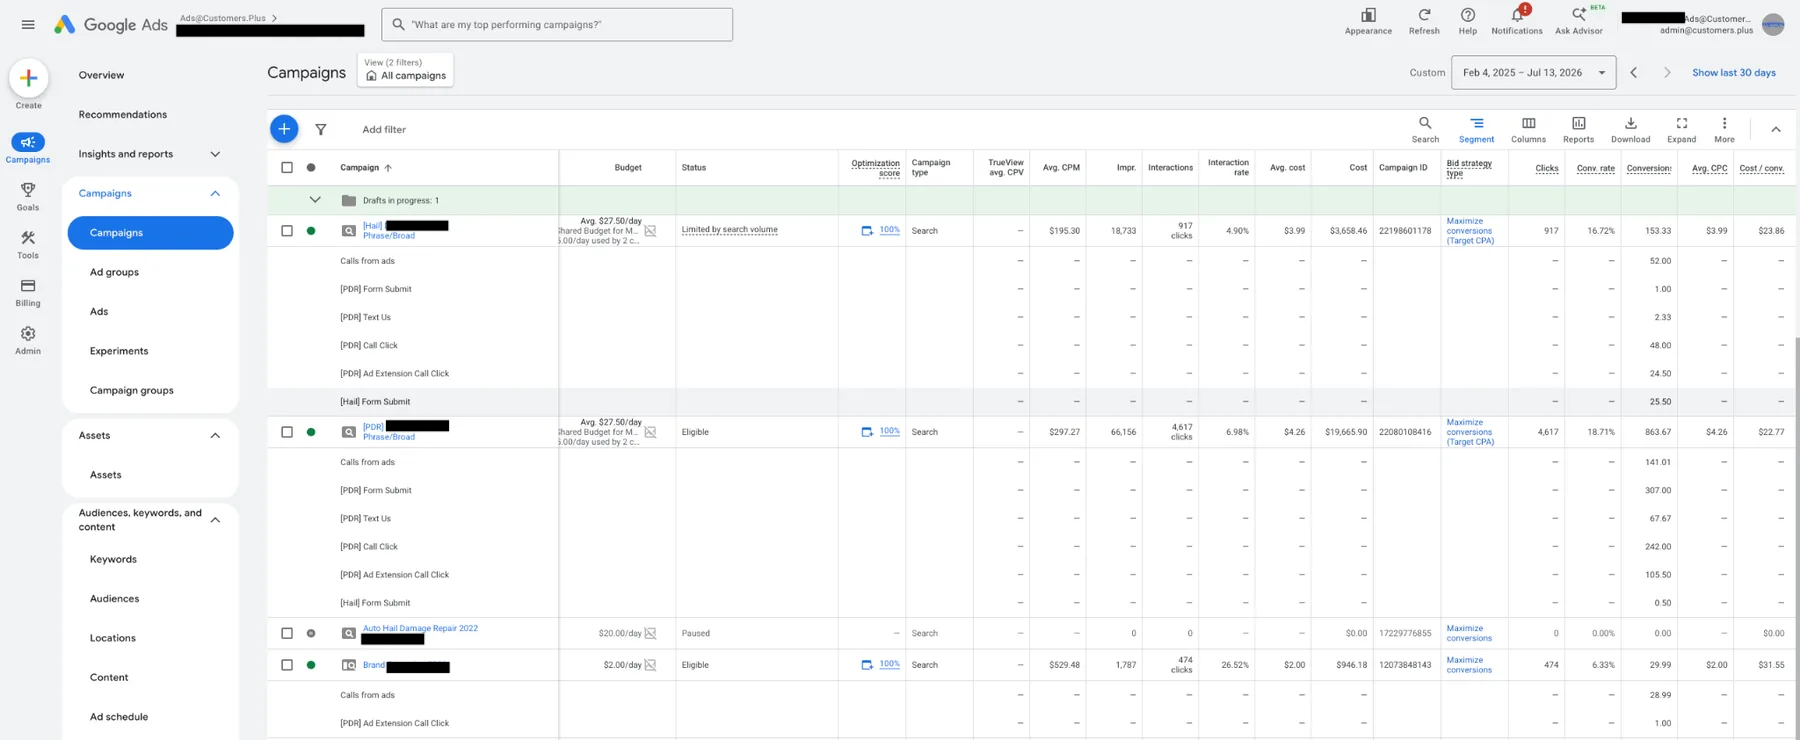
The original report used the account view from February 4, 2025 through July 13, 2026 as the longer baseline, then compared that performance with June 1–30, 2026.
| Metric | Feb. 4, 2025–Jul. 13, 2026 | June 2026 | Change | Interpretation |
|---|---|---|---|---|
| Impressions | 86,676 | 4,268 | Different Periods | Volume totals should not be compared directly because the date ranges differ. |
| Clicks | 6,008 | 333 | Different Periods | June generated 333 ad interactions. |
| Click / Interaction Rate | 6.93% | 7.80% | +12.6% | A larger percentage of impressions became clicks in June. |
| Average CPC | $4.04 | $4.06 | Essentially Flat | Traffic cost stayed nearly unchanged while downstream efficiency improved. |
| Conversion Rate | 17.43% | 20.42% | +17.2% | June clicks were more likely to complete a tracked action. |
| Cost / Conversion | $23.18 | $19.90 | −14.1% | The account generated tracked actions more efficiently in June. |
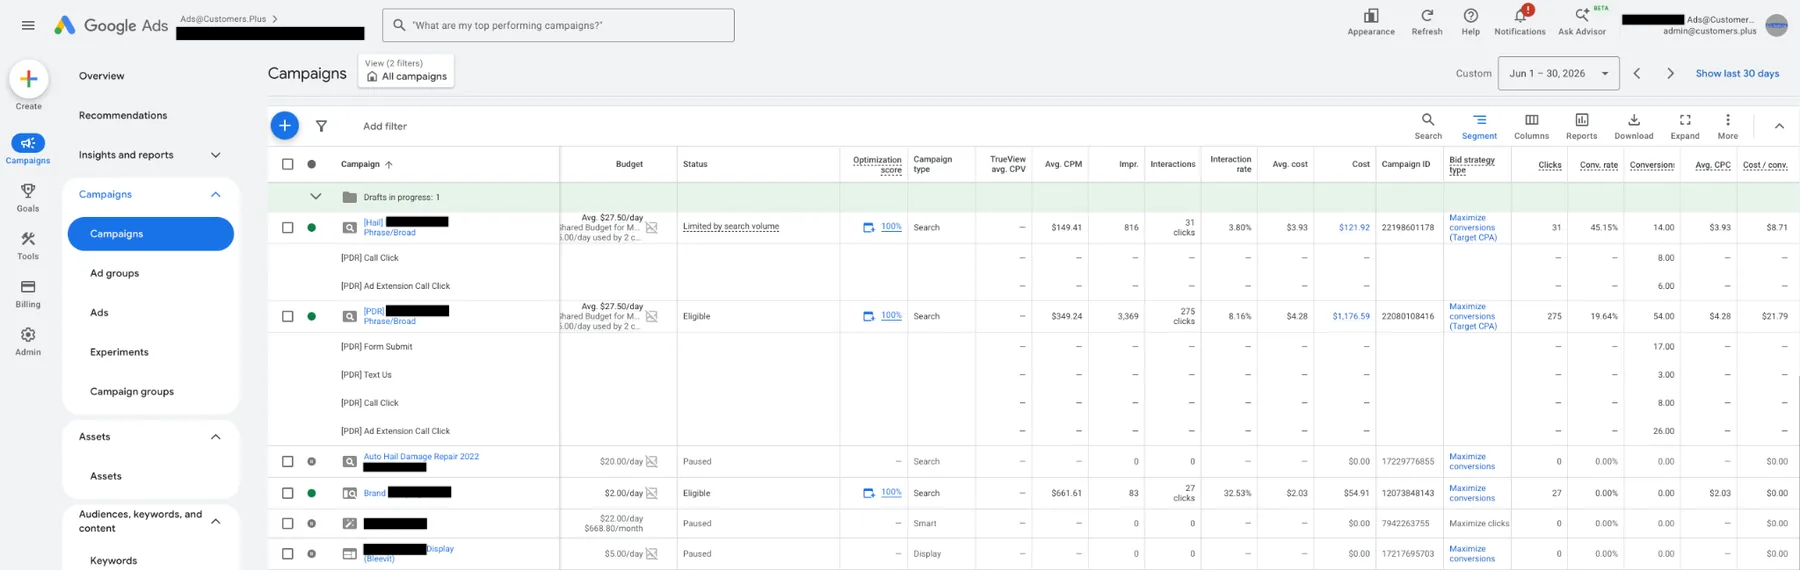
14 tracked conversions from 31 clicks on $121.92 in spend. This was the strongest efficiency result in the June campaign breakdown.
54 tracked conversions from 275 clicks on $1,176.59 in spend. Cost per conversion improved modestly compared with the longer account baseline.
The campaign produced 27 clicks for $54.91 but no tracked June conversions. The spend was small, so one month should be monitored rather than treated as a final judgment on the campaign.
Google Ads “conversions” are tracked actions, not necessarily unique customers or closed sales. The account includes actions such as calls from ads, website form submissions, text clicks, website call clicks, and ad-extension call clicks. Fractional totals can occur because of Google Ads attribution settings.
A single “we rank on Google” statement is too vague to be useful. These grids show why local SEO reporting becomes more meaningful when an agency tracks multiple service keywords across the same surrounding market.
“Tulsa Dent Repair,” “Auto Dent Removal,” “Dent Repair,” and “Hail Repair” can all describe relevant services, but Google does not have to treat them as the same query. The competitors, local relevance signals, search intent, and proximity effects can change with each phrase.
That is why agencies should avoid using one perfect-looking keyword grid as the entire SEO story. Tracking several revenue-relevant searches gives the client a more realistic picture of where visibility is already strong and where expansion opportunities remain.
A 196-square-mile scan intentionally tests locations well beyond the immediate area around the business. That makes it easier to see whether the Google Business Profile is visible only close to the physical location or whether strong rankings extend across a meaningful portion of the surrounding market.
For the strongest close-match query in this report, ARP 1.25, ATRP 1.25, and SoLV 100 indicate extremely consistent top local visibility across that particular scan configuration. The other keyword grids should be read on their own terms rather than treated as before-and-after comparisons.
A search grid becomes much easier to explain when the report is reduced to three ideas: where the business ranks when it appears, how it performs across the entire grid, and how often it reaches the top three.
ARP is the average ranking position across scan points where the business is found within the tracked ranking range. Lower is better. An ARP close to 1 means the business is usually appearing near the top when it is found.
ATRP accounts for all scanned points, including locations where the business is not found in the tracked top results. When ARP and ATRP are both low and close together, visibility is generally strong and consistent across the tested area.
Share of Local Voice measures how often the business ranks in positions 1–3 across the grid. A SoLV score of 100 means every tested point qualified for top-three Map Pack visibility for that keyword and scan configuration.
These metrics are useful because they turn a large visual grid into numbers an agency can track over time. The map remains the fastest client-facing explanation, while ARP, ATRP, and SoLV give the agency a repeatable way to document changes when the same keyword and scan settings are measured consistently.
Search-grid data should still be treated as visibility measurement rather than lead attribution. It shows where a Google Business Profile appeared for a search at the time of the scan. Calls, forms, appointments, estimates, and closed jobs should be measured separately if the agency wants to connect local visibility to business outcomes.
These are Google Business Profile ranking grids, not Google Search Console website-ranking reports. That distinction matters when agencies discuss HighLevel SEO results and the role a HighLevel website can play in a broader local-search strategy.
A HighLevel website does not need to sit outside the SEO strategy as a separate brochure site. When the site is built around relevant services, local structure, internal links, technical SEO, schema, conversion tracking, and continued content expansion, it can become one part of the local ecosystem supporting the business's search presence.
That is the operating model behind GHL Meets SEO V6 and the GHL Zone Agents: standardize research, content, images, page building, internal linking, publishing, indexing, and ongoing expansion directly around HighLevel. The claim is not that HighLevel itself creates rankings. The value is that agencies can build an SEO-oriented website and content system natively inside the platform they already use for CRM and automation.
This report is useful because it shows local organic visibility and paid acquisition together without pretending they are the same thing.
Compared with the longer account baseline, June's interaction rate improved from 6.93% to 7.80%, conversion rate improved from 17.43% to 20.42%, and combined cost per conversion fell from $23.18 to $19.90 while average CPC remained essentially flat at about $4.04–$4.06.
That is a paid-media efficiency story. It helps explain whether Google Ads is producing tracked actions more efficiently, but it does not prove anything about organic Google rankings.
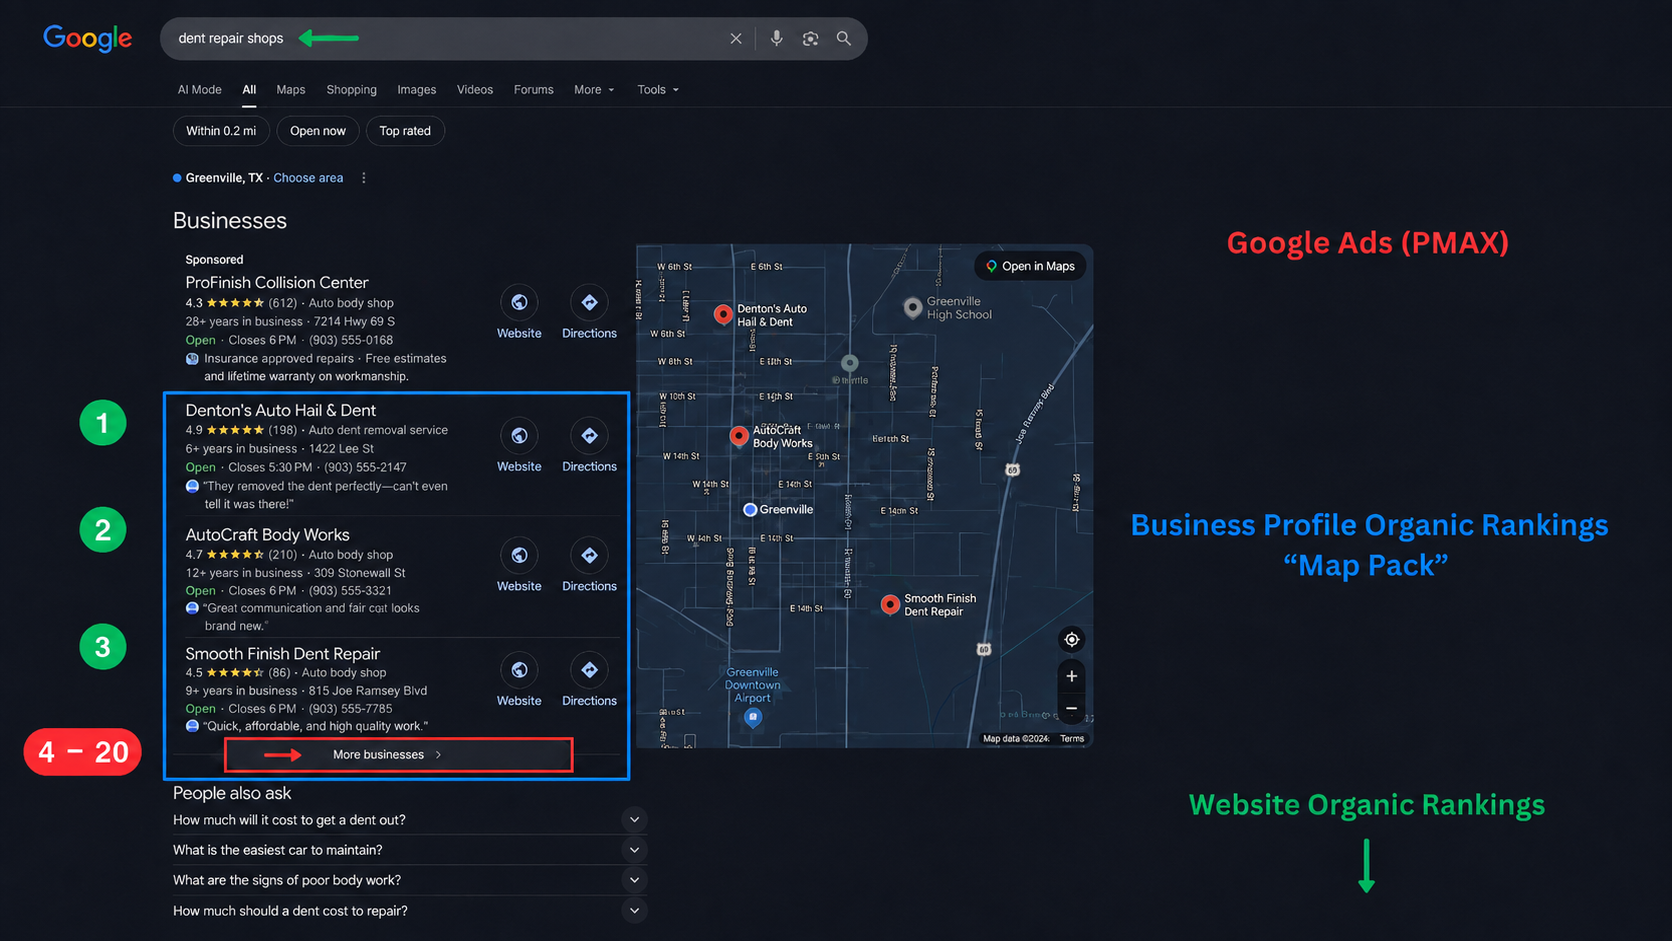
The Google Maps screenshots measure where the Google Business Profile appears organically from many locations. They help answer questions such as “How far does our local visibility extend?” and “Which service searches are strongest?” rather than “How much did we pay per lead?”
Keeping these two categories separate makes the report more credible. The agency can still explain how both channels contribute to the same business objective: generating more qualified opportunities.
Clients usually do not need every metric available in Google Ads, Google Business Profile, Search Console, Analytics, and HighLevel. They need the agency to identify what matters, preserve the evidence, and explain what changed in language that supports a business decision.
Local SEO often includes work that is difficult for a client to see directly: site structure, content expansion, internal links, metadata, schema, citations, profile optimization, and ongoing measurement. A map grid converts part of that work into an image the client can understand immediately.
Pairing the visual with a few definitions and a short explanation gives the client enough context to recognize progress without forcing them to learn the mechanics of local SEO.
An anonymized report can become a useful sales asset because it demonstrates how the agency thinks, measures, and communicates. A prospect can see actual Google Maps grids, actual paid-media data, and the reasoning used to separate different channels without exposing the original client.
This type of proof is often more useful than saying “we do SEO” or “we run Google Ads.” It shows the prospect what they can expect to understand after becoming a client.
The specific campaign or SEO strategy changes from client to client. The reporting structure can remain consistent.
Straightforward answers to the most useful questions raised by this mixed local SEO and paid-search case study.
Each number represents the Google Business Profile's organic local ranking position for the tracked keyword when the search is performed from that exact point on the map. Lower numbers are better. Positions 1–3 generally correspond to the primary local Map Pack.
Share of Local Voice measures how often the business ranks in positions 1–3 across the tested grid. A SoLV score of 100 means the business ranked in the top three at every tested point for that keyword and scan configuration.
A broad grid tests visibility well beyond the immediate area around the business. That helps an agency see whether rankings remain strong farther into the surrounding market, where proximity and different competitors may have a larger effect.
No. They represent four different keywords: Tulsa Dent Repair, Auto Dent Removal, Dent Repair, and Hail Repair. Each query has its own search intent and competitive landscape, so the grids should be used to compare keyword visibility patterns rather than to claim improvement from one screenshot to another.
No. Google Business Profile rankings depend on multiple local-search factors, including proximity, relevance, prominence, reviews, competition, categories, business information, website signals, and other factors. A well-built HighLevel website can support the broader local SEO ecosystem, but it does not control the Map Pack by itself.
Yes. A HighLevel website can be crawled and indexed when published correctly and can compete in organic search when it has useful content, a sound site structure, internal links, metadata, schema, mobile usability, backlinks, citations, and other relevant SEO signals. HighLevel itself does not guarantee rankings.
No. Google Ads is paid media. The ad performance section is included because it was part of the real client report and because paid search can complement local SEO while organic visibility develops. Paid conversions and organic rankings should remain clearly separated in reporting.
The useful comparison is between rate and efficiency metrics such as interaction rate, conversion rate, average CPC, and cost per conversion. Raw totals such as impressions, clicks, and conversions should not be compared directly because the date ranges are different.
Use separate metrics for separate channels, then connect them at the business-outcome level. Google Maps grids measure local visibility, Search Console measures organic website search performance, Google Ads measures paid traffic and tracked actions, and HighLevel or another CRM can connect calls, forms, appointments, estimates, and closed sales to the broader acquisition system.
GHL Meets SEO focuses on building and expanding SEO-oriented websites directly in HighLevel using standardized page structures, content workflows, internal linking, technical optimization, and GHL Zone Agents. Google Business Profile search grids are one way an agency can measure and communicate part of the broader local SEO picture. Rankings, traffic, leads, and revenue are never guaranteed.
Browse more anonymized GHL Meets SEO case studies, join the email list for new reports and Agent updates, or see how the White Label Partner model helps HighLevel agencies add website and SEO fulfillment without building another production department.