GHL Meets SEO — Header
[email protected] (828) 358-2389
Support Portal
Google Ads Scaling Case Study

Scaling Google Ads Budget Report: Home Cleaning Case Study

This case study uses a real, anonymized report from a home cleaning business in San Diego to show how two controlled Google Ads budget increases affected tracked conversions, cost per lead, actual spend, and paid lead efficiency. The original client-facing report is preserved first, followed by a deeper agency breakdown of what the numbers mean, how to communicate budget changes clearly, and how paid acquisition can fit beside a longer-term HighLevel SEO strategy.

Industry: Home Cleaning Market: San Diego, California Report Date: August 2026 Focus: Google Ads Budget Scaling Latest Cost / Lead: $12.02
GHL Meets SEO Anonymized Client Report · Google Ads Budget & Performance
All Case Studies
Prepared by GHL Meets SEO

Google Ads Budget Scaling Report

A simple look at the two most recent Google Ads budget increases for an anonymous San Diego home cleaning business, how lead performance responded, and how managed Google Ads compared with Local Services Ads over the same reporting periods.

Industry: Home Cleaning Market: San Diego Focus: Budget Scaling + Lead Cost Report Date: August 2026
Important: The monthly budget is the amount Google is allowed to use. It does not guarantee Google will spend every dollar. Actual spend changes with search demand, auction conditions, campaign eligibility, targeting, bidding, and other factors.
Section 01

Current Budget & Lead-Cost Snapshot

These three numbers give the client the fastest possible summary before looking at each budget change in detail.

Current Monthly Budget $4,115
Latest Cost Per Lead $12.02
Target Cost Per Lead $13–$14
Section 02

Budget Changes & Performance Response

Each change keeps the original request, applied budget, performance metrics, and supporting Google Ads screenshot together so the client can see exactly what happened after the budget ceiling changed.

Budget Increase #1

Requested +$1,000 / Month

Requested Apr. 28, 2026 · Applied Apr. 30, 2026
Monthly Budget After Change $3,775
Search Campaign $85/day → $112.25/day
PMax Campaign $10/day → $12.50/day
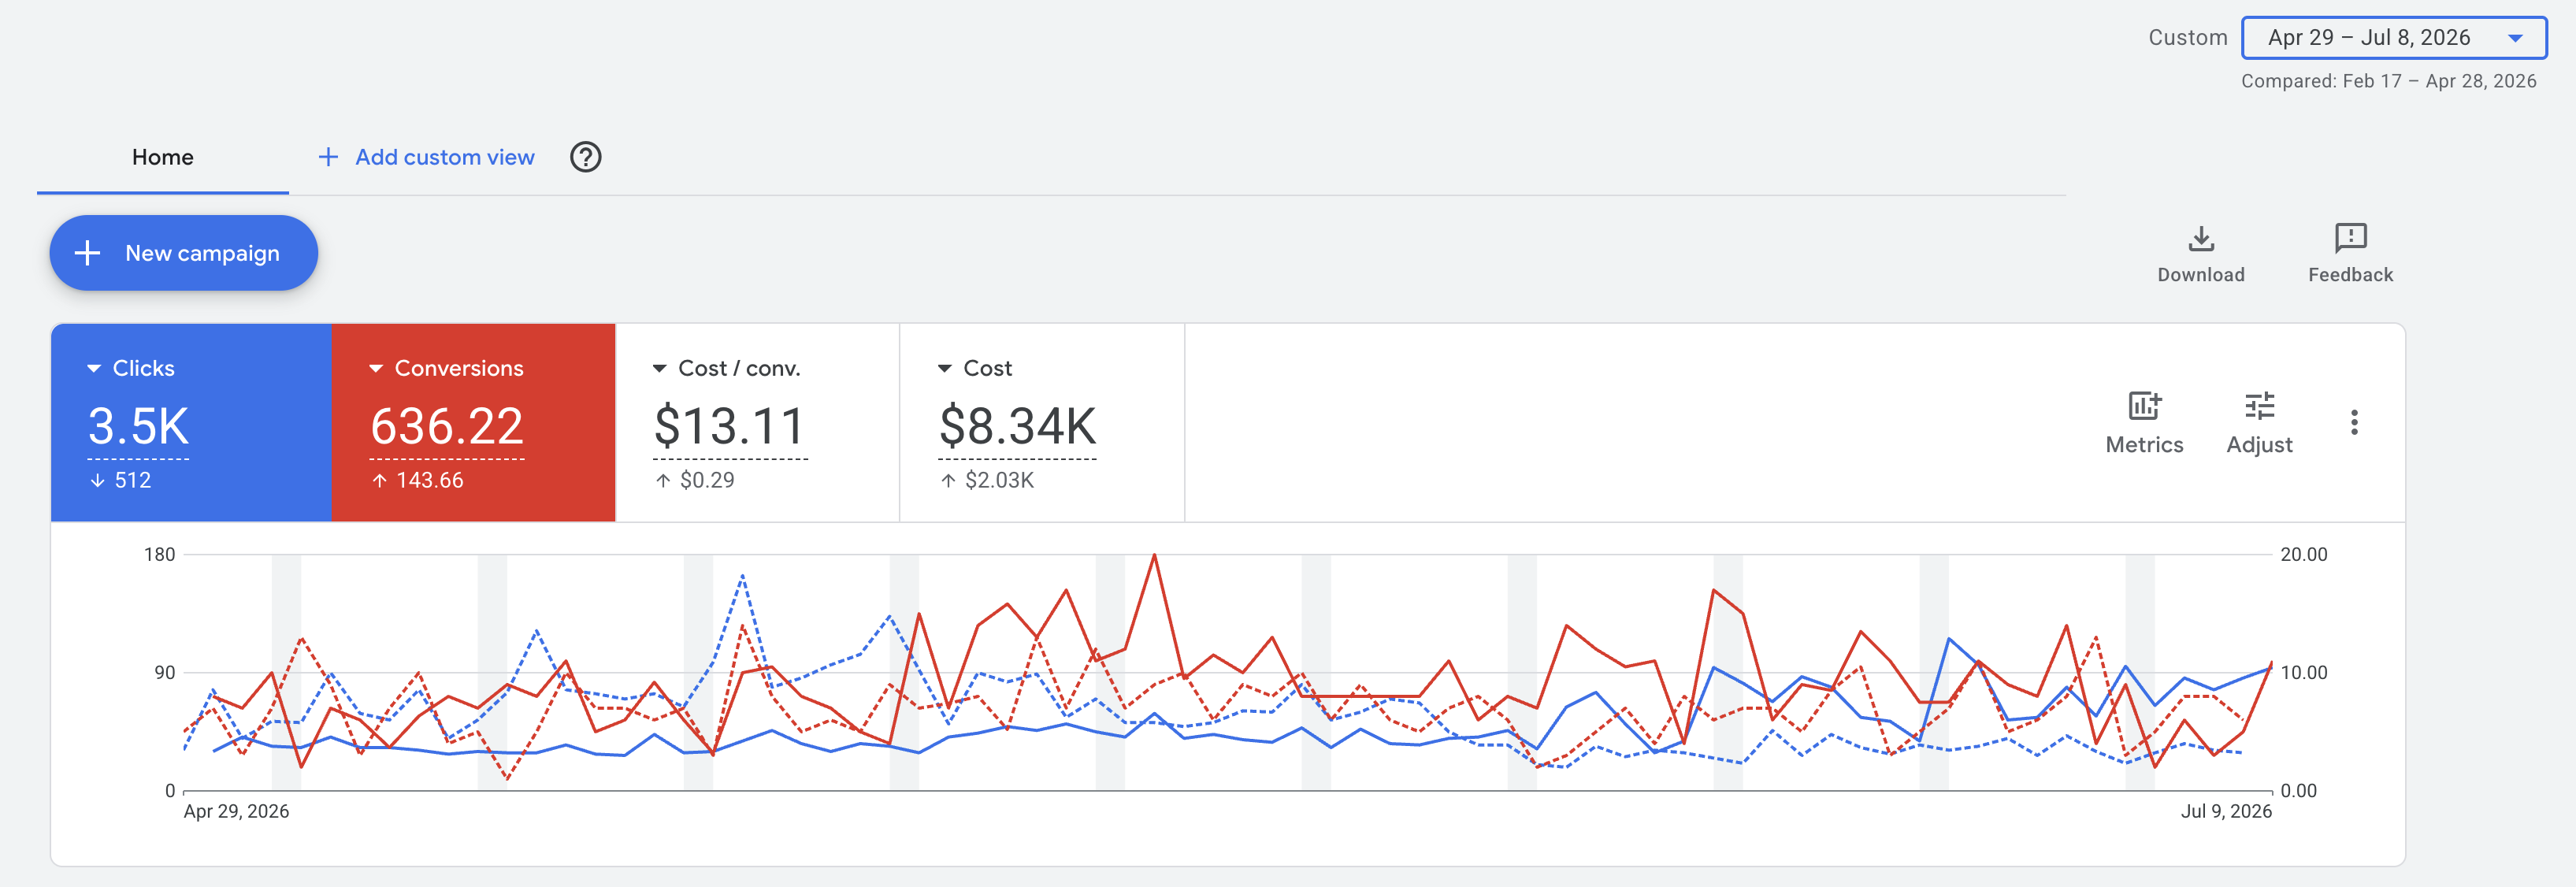
+143 More tracked conversions
−512 Fewer clicks needed
$13.11 Cost per lead (+$0.29)
+$2.03K Total spend over 70 days
Result: More tracked conversions came from fewer clicks while cost per lead stayed essentially flat and inside the target range.
70-Day Google Ads Comparison
Anonymized GHL Meets SEO Google Ads performance comparison for a San Diego home cleaning case study showing 3.5 thousand clicks, 636.22 tracked conversions, 13 dollars and 11 cents cost per conversion, 8.34 thousand dollars in spend, and trend lines across the 70-day reporting period.
Budget Increase #2

Requested +10% to Search Budget

Requested Jul. 6, 2026 · Applied Jul. 8, 2026
Monthly Budget After Change $4,115
Search Campaign $112.25/day → $123.50/day
PMax Campaign $12.50/day → No change
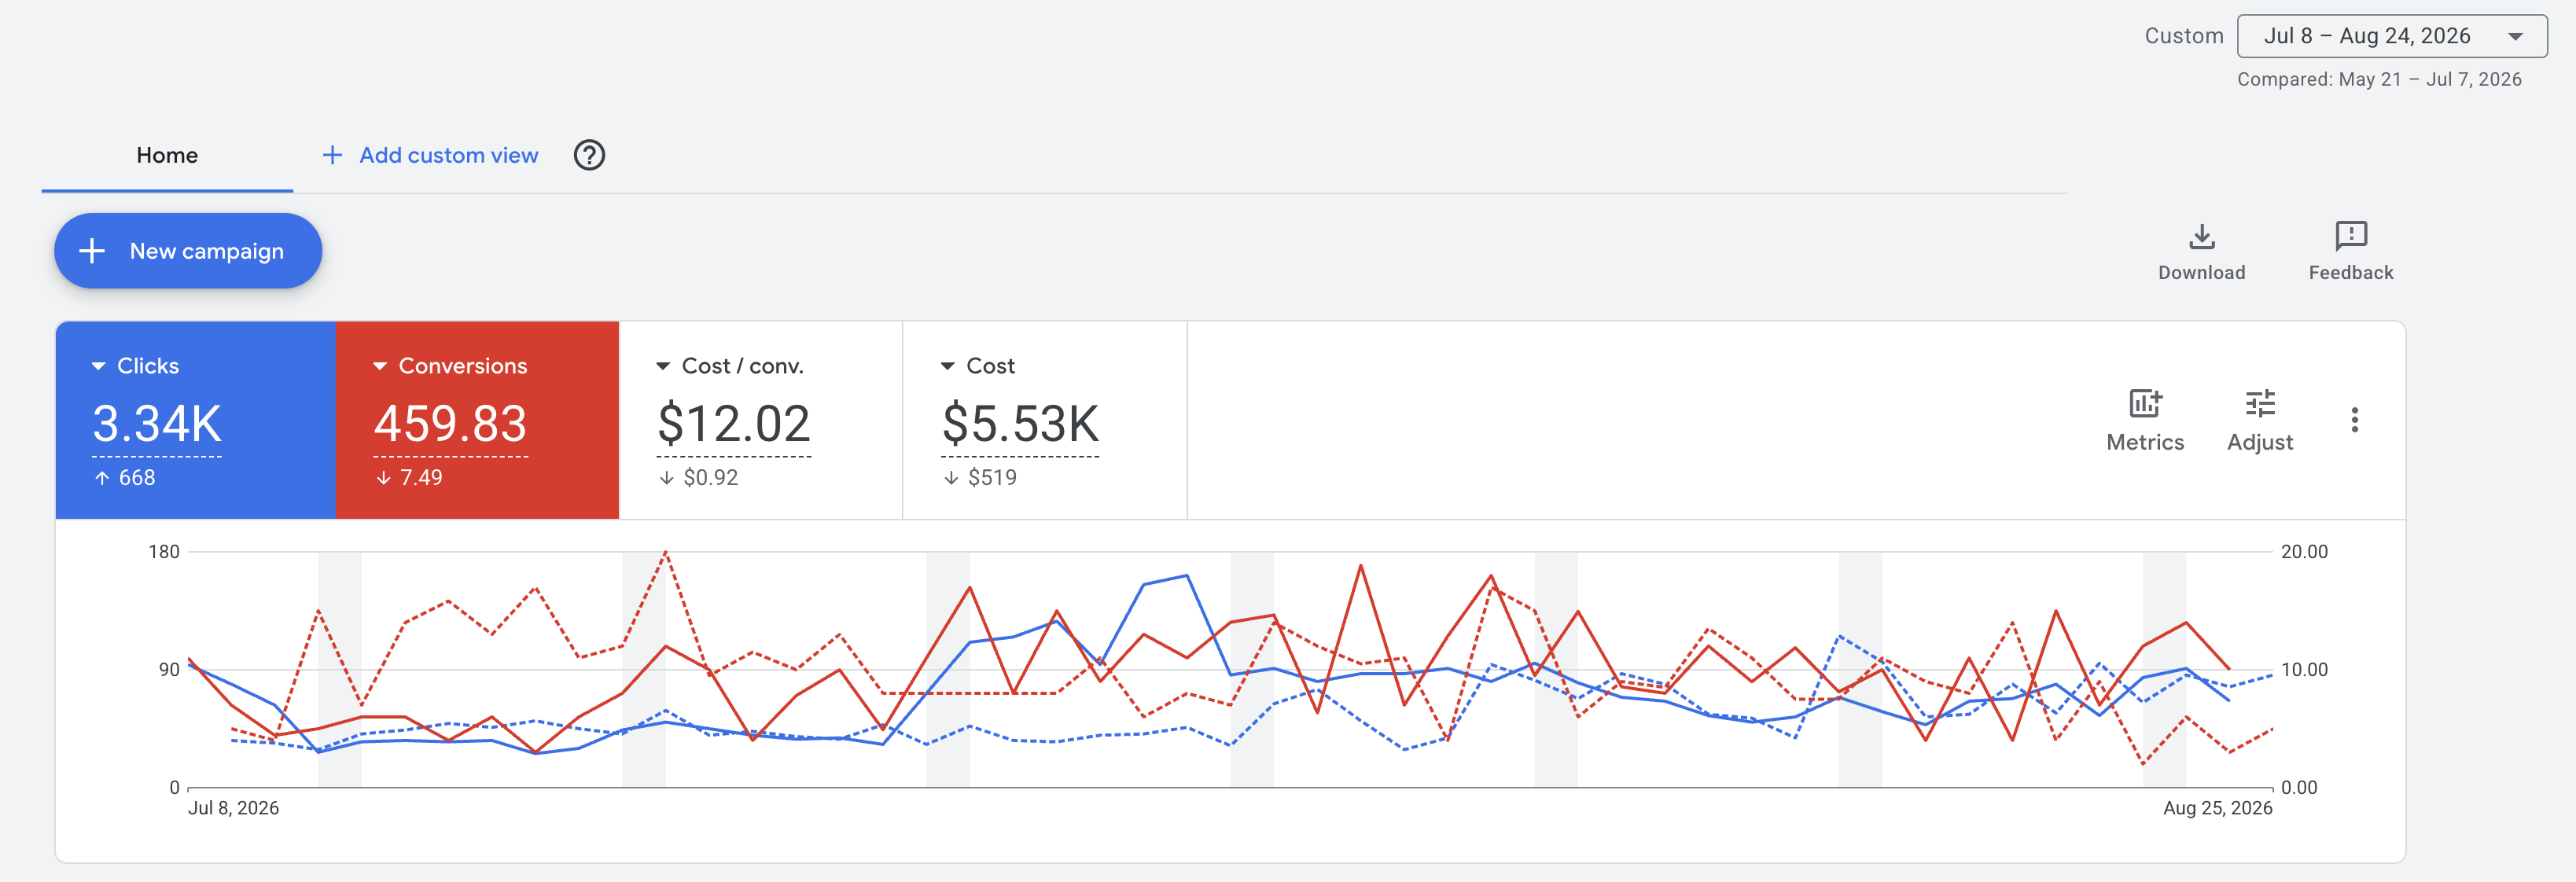
+668 More clicks
−7 Tracked conversions
$12.02 Cost per lead (−$0.92)
−$519 Total spend over 47 days
Result: Tracked lead volume stayed nearly the same while cost per lead improved and Google spent less overall.
This second comparison is less conclusive because the test period was shorter, overlapped the prior increase, and the budget change was smaller. A 5–6% fluctuation in results can be normal even without a budget change.
47-Day Google Ads Comparison
Anonymized GHL Meets SEO Google Ads performance comparison for a San Diego home cleaning case study showing 3.34 thousand clicks, 459.83 tracked conversions, 12 dollars and 2 cents cost per conversion, 5.53 thousand dollars in spend, and trend lines across the 47-day reporting period.

What This Means for the Next Increase

The account handled both increases without pushing lead cost outside the target range. The first increase produced a strong lift in tracked conversions, while the second maintained similar conversion volume with a lower cost per lead. Based on this history, another controlled budget increase is reasonable to test while continuing to monitor actual spend, conversion volume, and cost per lead.

Section 03 · Google Ads vs. Local Services Ads

Lead Cost Comparison

Same-date comparison of the managed Google Ads campaigns against Local Services Ads, focused on spend, lead volume, and cost per lead.

Google Ads Cost / Lead $13.11 → $12.02 Improved by $1.09
LSA Cost / Lead $18.01 → $19.44 Increased by $1.43
Latest Cost / Lead Gap $7.42 Lower Google Ads vs. LSA

Apr. 29 – Jul. 8, 2026

70-day comparison
Ad Source
Total Spend
Est. / Month
Leads
Cost / Lead
Google Ads Managed campaigns
$8.34K 70 days
≈ $3,610 30.3-day average
636 Tracked conversions
$13.11 Per conversion
Local Services Ads 120 phone + 253 message leads
$6,719.50 70 days
≈ $2,909 30.3-day average
373 Charged leads
$18.01 Per charged lead
Google Ads produced about 263 more tracked conversions/leads during the same period at a $4.90 lower cost per reported lead.
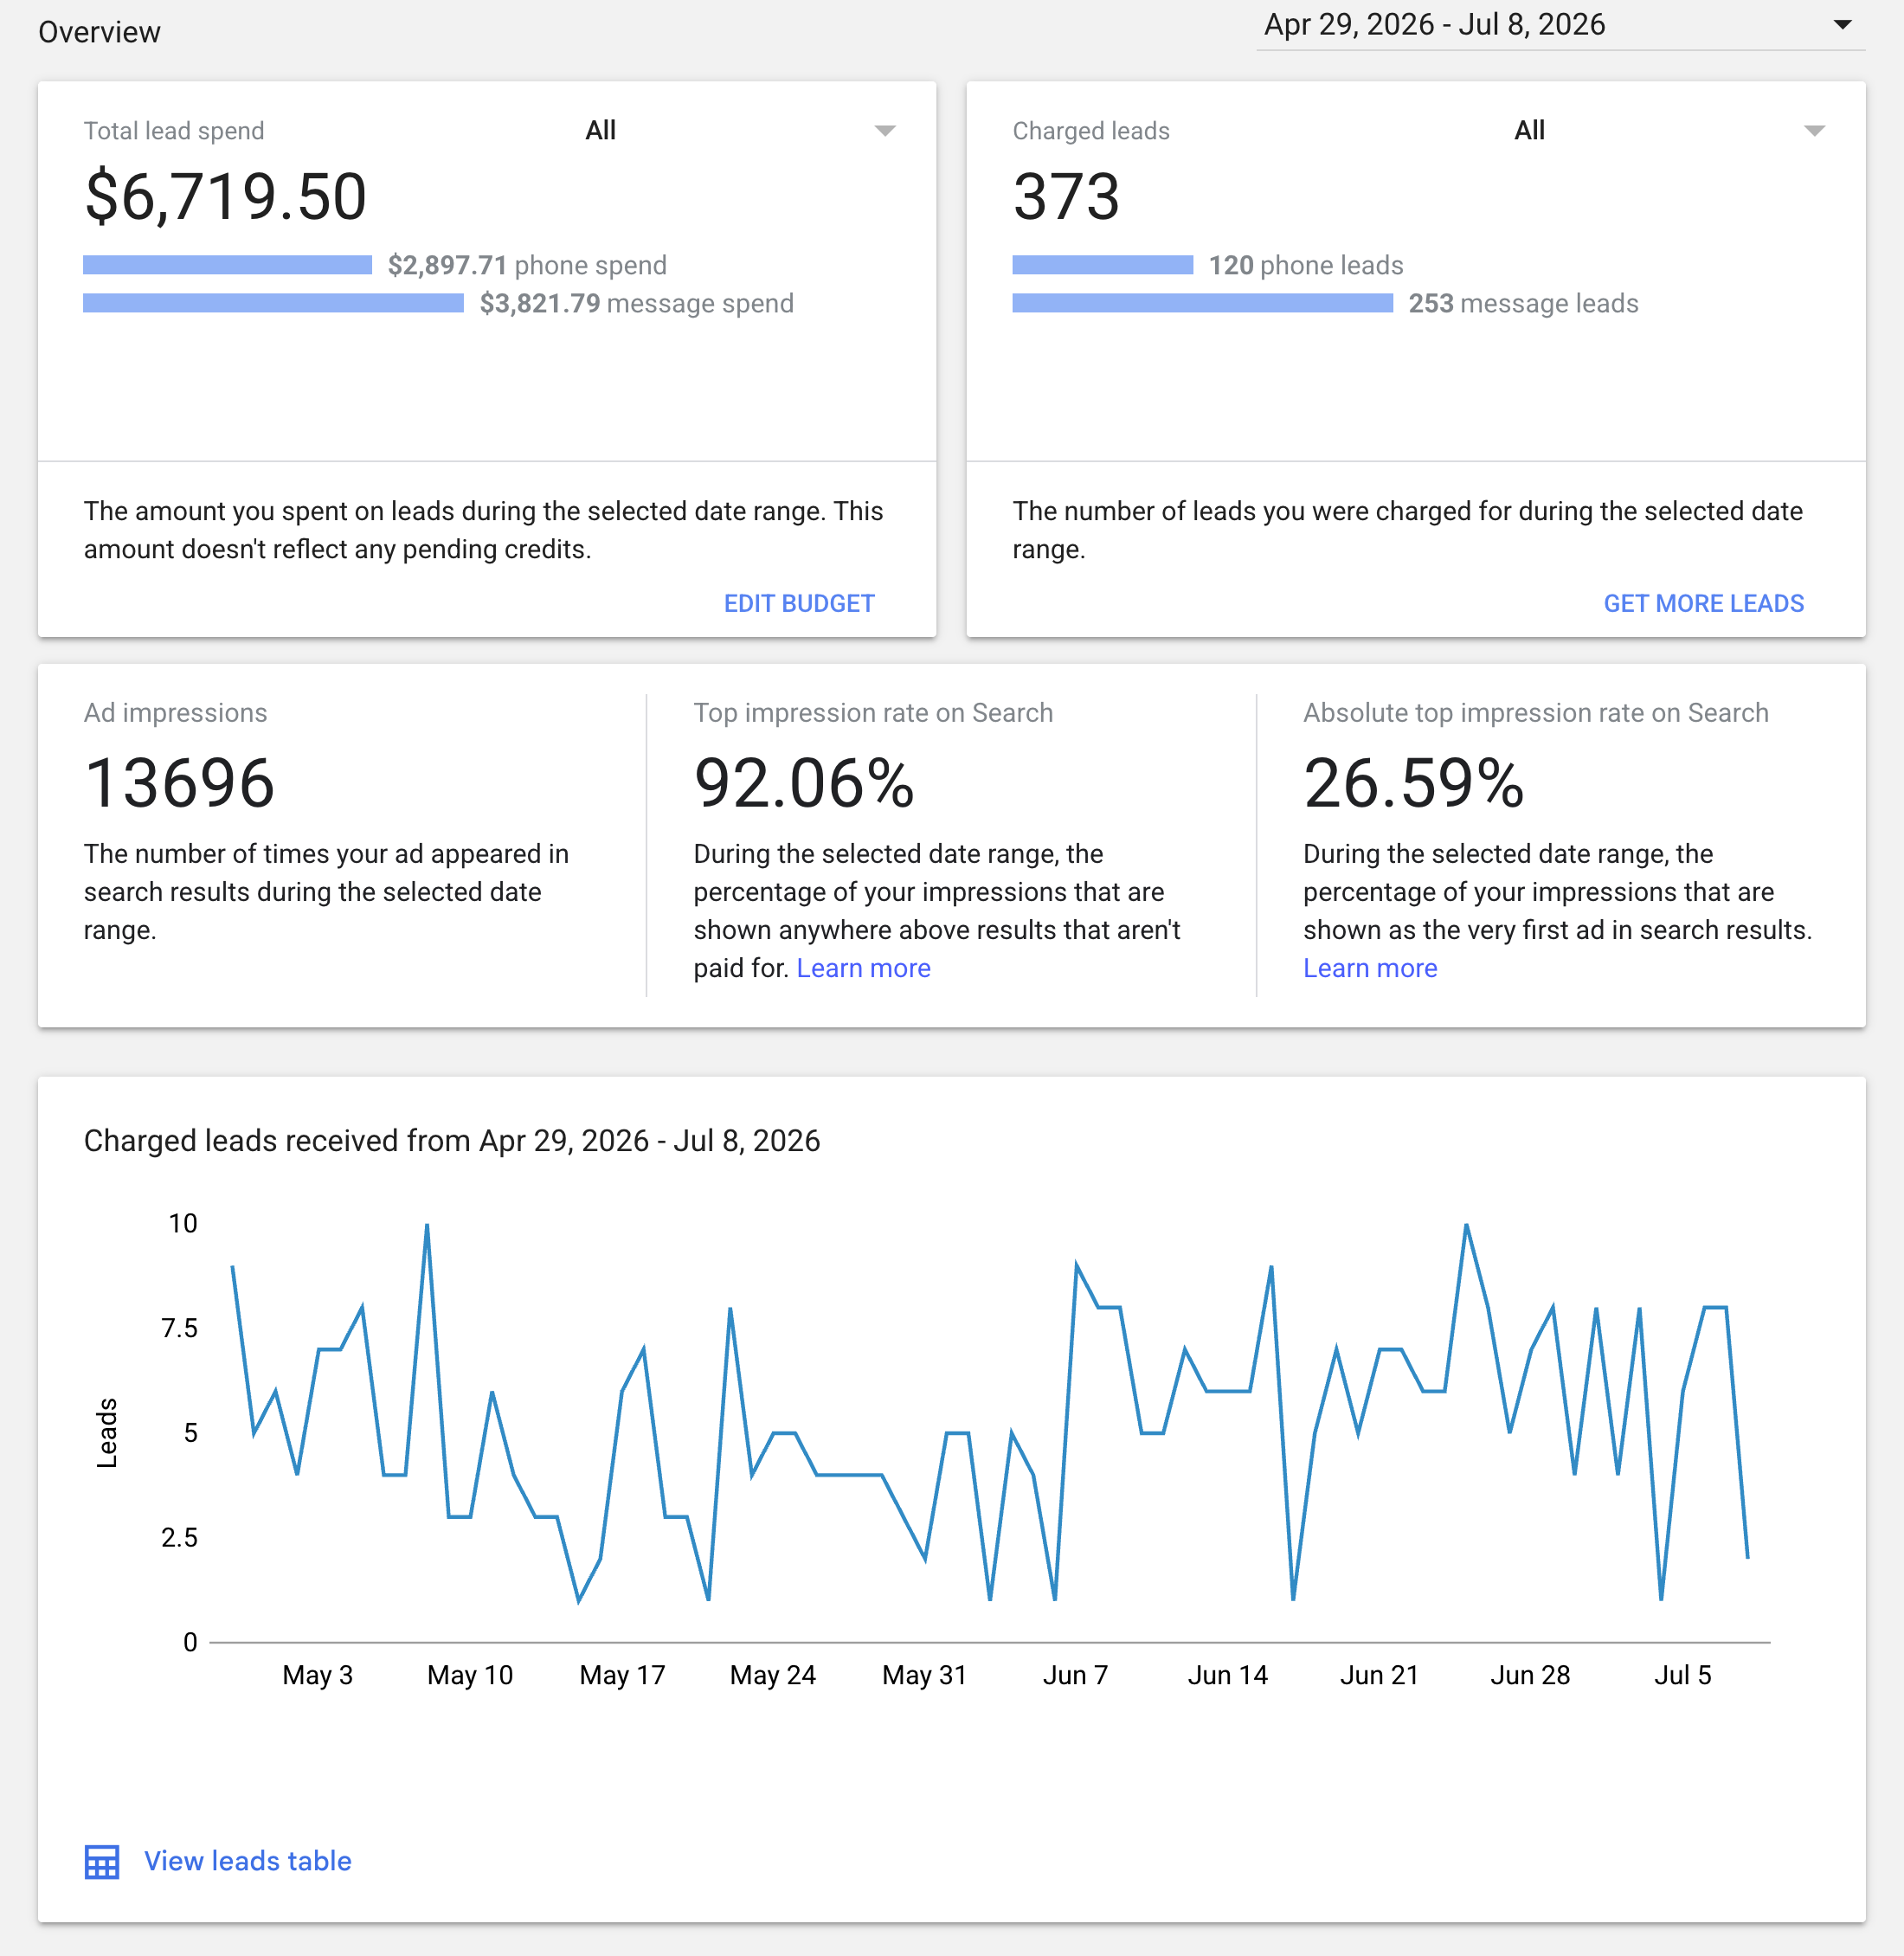
Local Services Ads Results — Apr. 29 to Jul. 8
Anonymized Local Services Ads screenshot for a San Diego home cleaning case study showing 6,719 dollars and 50 cents in total lead spend, 373 charged leads, 120 phone leads, 253 message leads, 13,696 ad impressions, 92.06 percent top impression rate, and 26.59 percent absolute top impression rate from April 29 through July 8, 2026.

Jul. 8 – Aug. 24, 2026

47-day comparison
Ad Source
Total Spend
Est. / Month
Leads
Cost / Lead
Google Ads Managed campaigns
$5.53K 47 days
≈ $3,565 30.3-day average
460 Tracked conversions
$12.02 Per conversion
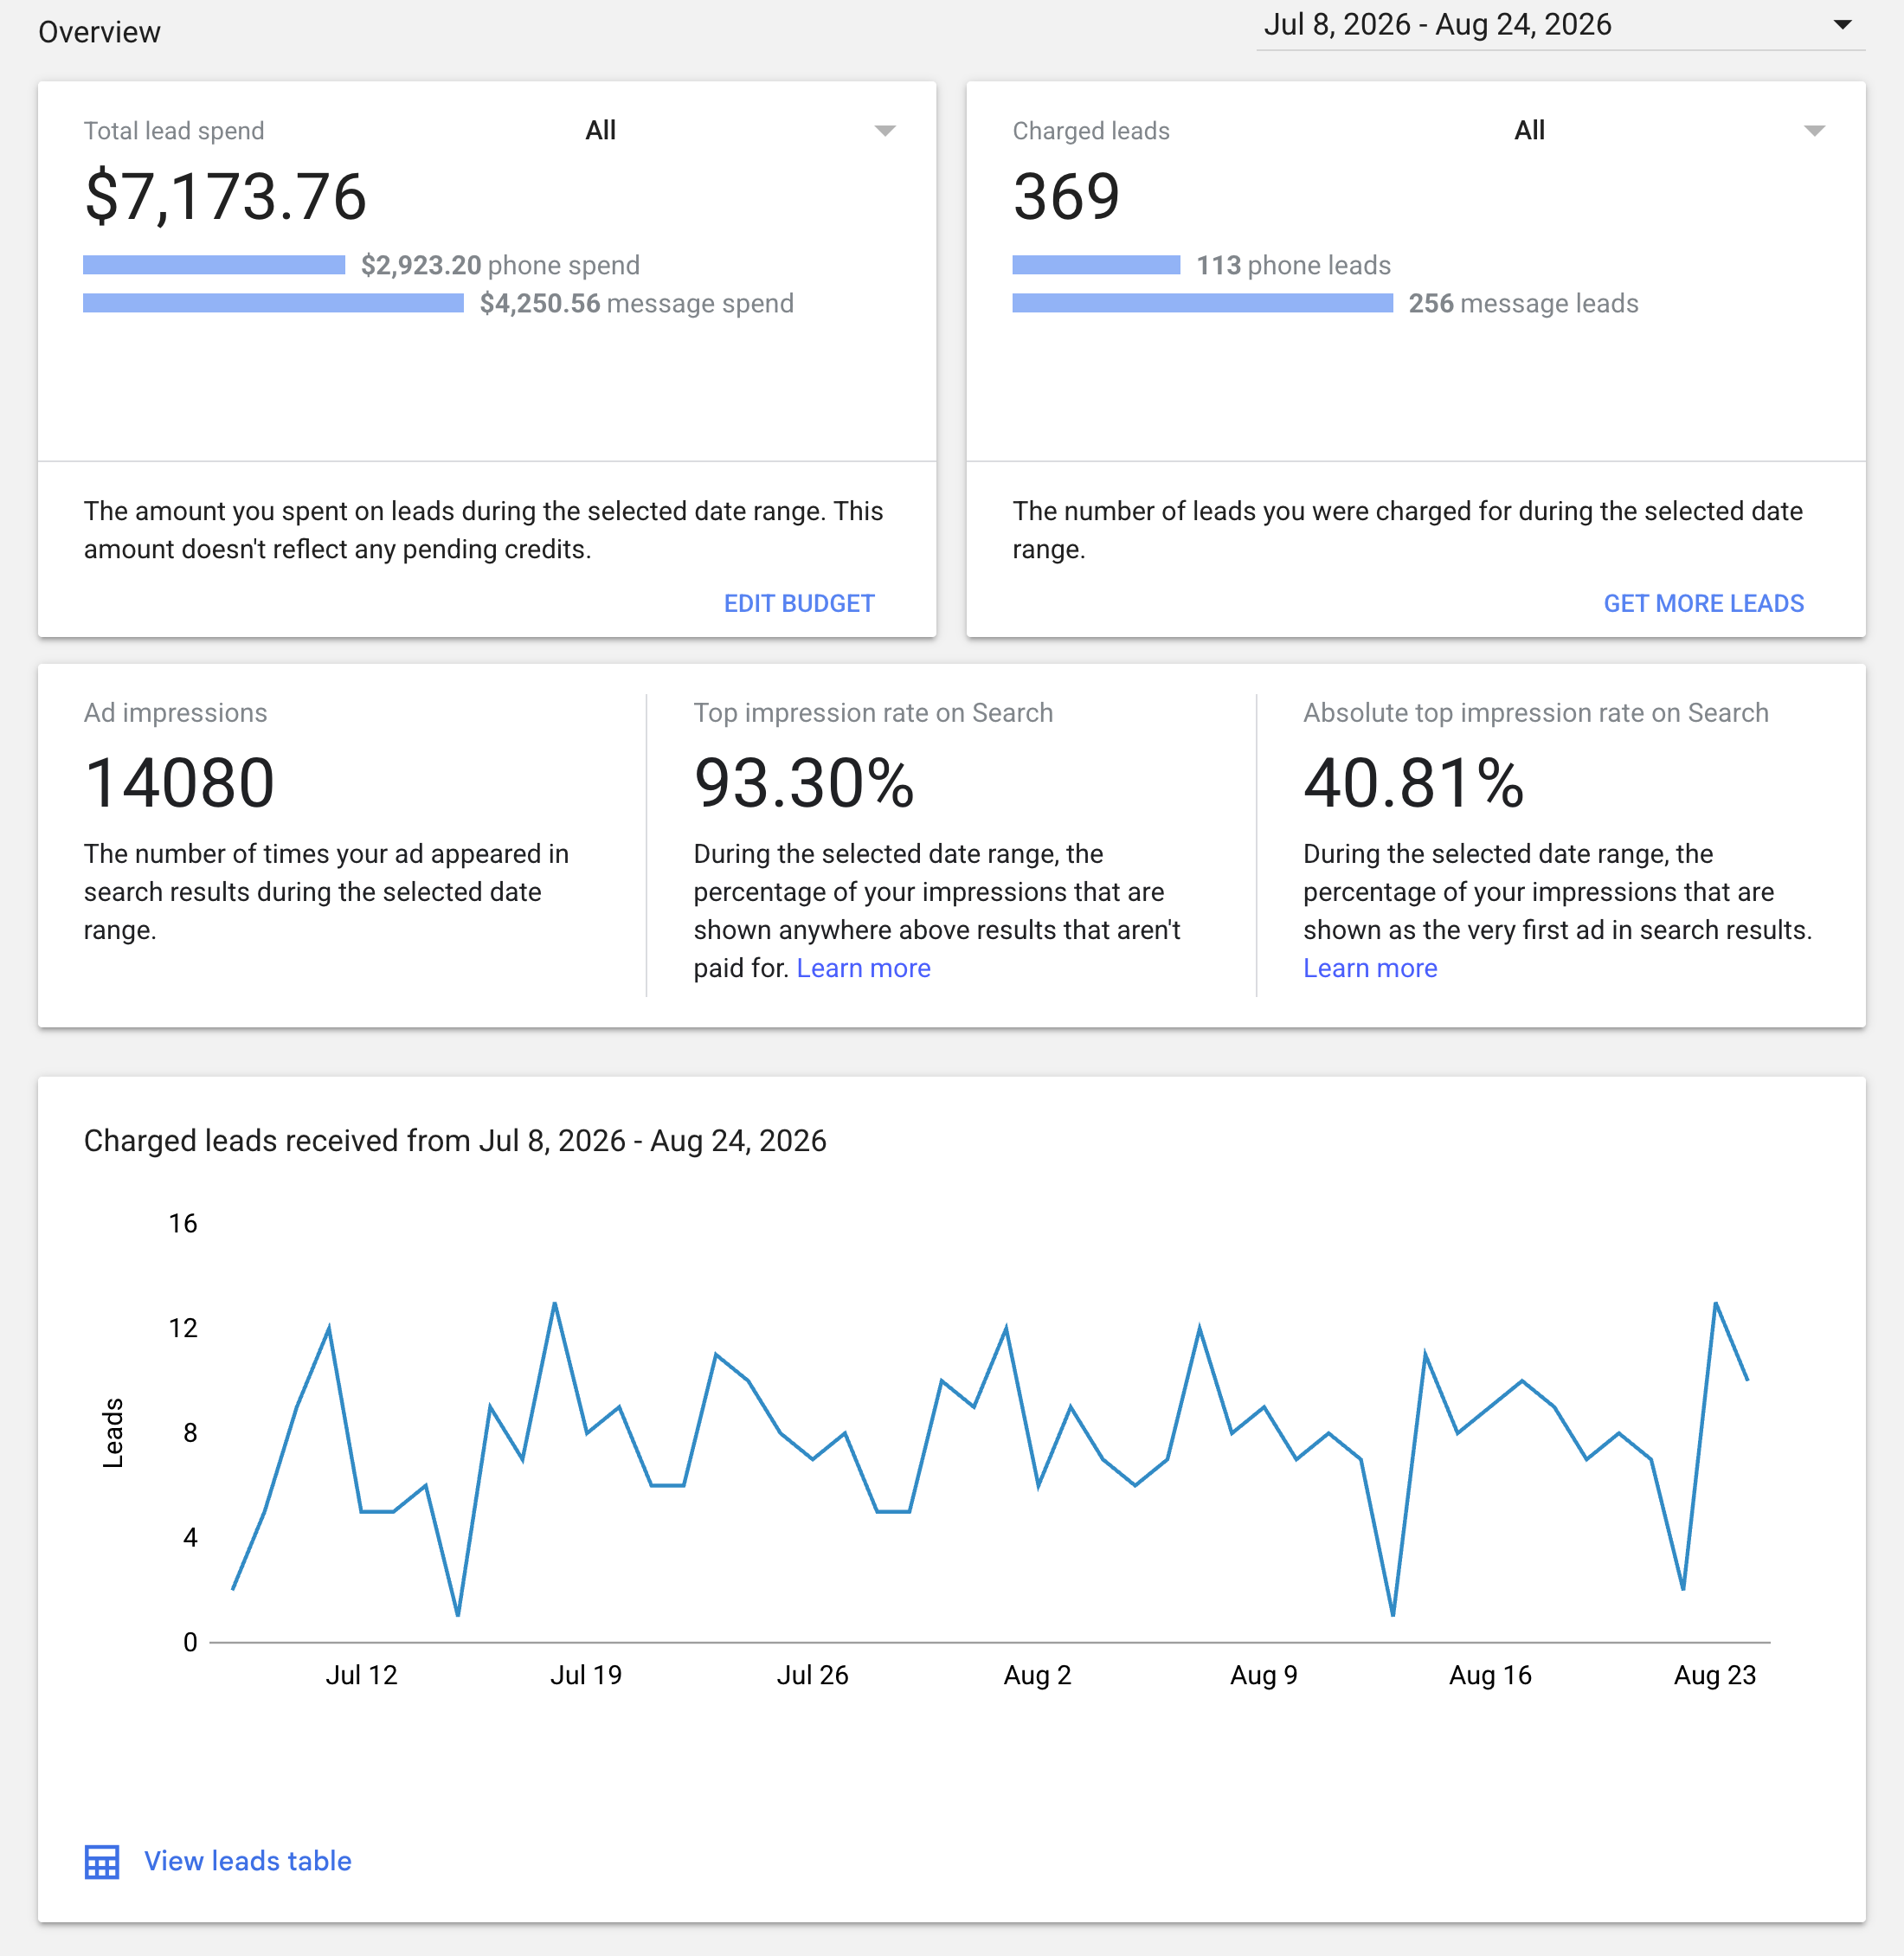
Local Services Ads 113 phone + 256 message leads
$7,173.76 47 days
≈ $4,625 30.3-day average
369 Charged leads
$19.44 Per charged lead
Google Ads produced about 91 more tracked conversions/leads while spending about $1,644 less during the same 47-day period. Reported cost per lead was $7.42 lower.
Local Services Ads Results — Jul. 8 to Aug. 24
Anonymized Local Services Ads screenshot for a San Diego home cleaning case study showing 7,173 dollars and 76 cents in total lead spend, 369 charged leads, 113 phone leads, 256 message leads, 14,080 ad impressions, 93.30 percent top impression rate, and 40.81 percent absolute top impression rate from July 8 through August 24, 2026.
Bottom Line: Google Ads was producing reported leads more efficiently during these periods. Managed Google Ads cost per conversion improved from $13.11 to $12.02, while reported LSA cost per charged lead increased from $18.01 to $19.44. LSA can still add useful lead volume, but the managed Google Ads campaigns showed the lower reported lead cost in both periods.

Estimated monthly spend is calculated from actual spend over each period using a 30.3-day average month. Google Ads totals are based on the rounded spend shown in the comparison screenshots. Local Services Ads reports charged leads while Google Ads reports tracked conversions, so these are useful directional comparisons rather than perfectly identical lead definitions.

Paid media note: These Google Ads and Local Services Ads results are not SEO results. They are included because paid acquisition is part of the client reporting picture and can complement a broader organic strategy. A long-term SEO objective may be to reduce dependence on paid traffic as organic visibility grows, while continuing paid campaigns when the economics remain attractive.
Paid Acquisition Analysis

What the First Budget Increase Actually Proved

A budget increase is only useful when the account can absorb more spend without destroying efficiency. The first 70-day comparison is the cleaner of the two tests because the increase was larger and the observation window was longer.

Tracked Conversions +143 Approximately 29% more than the preceding comparison period.
Clicks −512 More conversions were recorded even with fewer clicks.
Cost / Conversion $13.11 Only about $0.29 above the preceding period.
Target Range $13–$14 The resulting CPL remained inside the target range.

The strongest story is not simply that the account spent more. The more useful story is that the additional budget produced substantially more tracked conversions while the cost required to generate each conversion remained nearly flat. In other words, the campaign did not immediately show the classic warning sign of scaling too aggressively: rapidly rising cost per lead with little additional volume.

That matters for an agency because clients often ask a deceptively simple question: “If I spend more, will I get more leads?” No responsible advertiser can guarantee that outcome. What an agency can do is show the client how the account responded to prior controlled increases. Historical performance creates a much stronger basis for the next test than intuition alone.

This is also why the screenshot and the short summary belong together. A client may not want to interpret every line on a Google Ads chart, but the agency can reduce the report to three points: more tracked conversions, lead cost still within target, and enough evidence to justify another measured test. The raw screenshot remains available as proof without forcing the client to become a media buyer.

Budget Scaling

A Higher Google Ads Budget Does Not Mean Google Will Spend More

The second increase is useful because it demonstrates one of the most important budget concepts to explain to clients: the budget is a ceiling, not a guaranteed invoice.

The Budget Increased

Search moved from $112.25/day to $123.50/day while PMax stayed at $12.50/day. That gave the account additional room to participate when qualified search demand was available.

  • Monthly budget ceiling moved to approximately $4,115.
  • The change was smaller than the first increase.
  • The comparison window was 47 days rather than 70 days.

Actual Spend Went Down

Even with the higher Search budget, the later comparison shows about $519 less actual spend while reported cost per conversion improved to $12.02.

  • Clicks increased by about 668.
  • Tracked conversions were nearly flat, down about seven.
  • Cost per conversion improved by roughly $0.92.

This is exactly why a client report should distinguish budget from spend. Increasing a daily limit does not create additional search demand. It simply gives the campaign permission to capture more eligible traffic when the auction, targeting, bids, conversion signals, and available searches make that possible.

The second comparison should also be communicated with more caution than the first. It overlaps the earlier increase, uses a shorter period, and involves a smaller budget adjustment. That does not make the data useless; it means the correct agency conclusion is narrower: the account continued operating near the desired lead-cost range after the higher ceiling, but the period does not isolate the budget change well enough to claim that the increase itself caused the outcome.

Reporting discipline: Strong case studies are more credible when they explain what the data cannot prove. Separating correlation from causation helps agencies build trust with existing clients and makes the proof more believable when it is later reused in sales.
Channel Comparison

Why Google Ads vs. Local Services Ads Is Useful—but Not Perfectly Apples to Apples

The same-date comparison gives the agency a practical view of paid lead efficiency across two Google channels, but the lead definitions and attribution systems are different.

What the Data Shows Clearly

In both reporting windows, the managed Google Ads campaigns showed a lower reported cost per lead/conversion than Local Services Ads.

  • Period 1: $13.11 Google Ads vs. $18.01 LSA.
  • Period 2: $12.02 Google Ads vs. $19.44 LSA.
  • Latest reported gap: $7.42 lower for Google Ads.

What Requires Context

Google Ads is reporting tracked conversions while LSA is reporting charged phone and message leads. Those definitions can differ in attribution, duplicates, lead quality, and what each platform counts.

  • A lower platform CPL does not automatically mean higher profit.
  • Lead quality should be checked in the CRM whenever possible.
  • Revenue and booked-job data are stronger downstream measures.

For agencies, the best next step is to connect this media data to HighLevel or another CRM. When calls, forms, conversations, appointments, estimates, and closed sales are tracked downstream, the conversation can move from cost per platform-reported lead to cost per qualified opportunity or acquired customer. That is a more useful way to compare channels as the account matures.

The visual report still has value before that deeper attribution is perfect. It tells the client that the agency is not looking at Google Ads in isolation; it is comparing available channels, watching efficiency, and making budget recommendations based on the numbers instead of simply recommending higher spend.

Free Planning Tool

Turn Cost Per Lead Into a Practical Google Ads Budget

Once an agency has a believable cost-per-lead range, budget planning becomes much easier to explain. Instead of starting with an arbitrary monthly number, start with the lead volume the business wants and work backward from the expected acquisition economics.

Free Google Ads Budget Calculator

Use the calculator to model budget from expected cost per click, conversion rate, cost per lead, and desired lead volume. It is useful for initial planning, client conversations, and sanity-checking whether a proposed monthly budget can realistically support the number of leads being discussed.

Historical data from an existing account is usually more useful than a generic benchmark. For a new account without history, the calculator can provide a starting model that should be revised as real conversion data comes in.

Free Resource Plan Google Ads Budgets From the Numbers Open Budget Calculator

A simple budgeting conversation might sound like this: if the account is consistently producing leads near $12–$14 and the business wants materially more qualified opportunities, the agency can estimate the additional spend required, raise the ceiling in a controlled step, and then watch whether CPL remains stable as volume increases.

What the calculator cannot do is guarantee traffic, leads, booked jobs, or revenue. Google still determines how much eligible traffic exists, and conversion rates change with search intent, landing pages, competition, seasonality, offer strength, sales follow-up, and many other variables. The tool is best used as a planning model—not as a promise.

HighLevel SEO + Paid Acquisition

Google Ads Results Are Not SEO Results—But the Reporting Still Matters to HighLevel Agencies

This case study is about paid acquisition. It does not demonstrate HighLevel website rankings or organic SEO performance. The agency lesson is how paid and organic channels can be measured together without confusing what each channel is responsible for.

Where Paid Search Helps

Google Ads can provide immediate demand capture while an organic strategy is still developing. For a local service company, it can also produce useful conversion data that helps the agency understand which services, messages, locations, and search themes are generating real response.

  • Immediate visibility for high-intent searches.
  • Fast testing of offers, landing pages, and conversion paths.
  • Lead and keyword data that can inform broader marketing decisions.
  • A controllable acquisition channel while SEO compounds over time.
  • Clear cost-per-conversion data for client reporting.

Where HighLevel SEO Fits Long Term

A HighLevel website built around dedicated service pages, service-area pages, internal linking, schema, conversion tracking, and continued content expansion can support a broader organic-search strategy. That does not make paid ads unnecessary, and it does not guarantee organic rankings.

  • Build an owned website asset instead of relying only on paid traffic.
  • Expand search coverage with useful service and location content.
  • Use Search Console, Analytics, GBP, calls, forms, and CRM data to measure organic progress.
  • Reduce dependence on paid acquisition when organic visibility becomes strong enough to contribute meaningful lead volume.
  • Keep profitable paid campaigns running when additional paid volume still makes business sense.

For agencies using GHL Meets SEO, the broader model is not “SEO instead of ads.” It is to build a stronger owned website foundation inside HighLevel, expand that asset with ongoing content when appropriate, and use paid channels strategically while the organic side develops. Over time, one goal may be to generate a larger percentage of demand without paying for every click.

The same principle applies even if an agency does not use GHL Meets SEO. Separate the channels in reporting, explain what each metric actually measures, and show how the pieces work together. When a client sees paid leads, local visibility, website traffic, calls, forms, and closed opportunities as parts of one acquisition system, the agency becomes easier to value than when reporting is reduced to a monthly PDF full of disconnected numbers.

A Repeatable Google Ads Reporting Workflow for Agencies

The exact ad platform views can change. The reporting process should stay simple enough that clients understand it and consistent enough that the agency can repeat it at scale.

1
Record the Change Save the requested budget, applied date, and campaign-level adjustment.
2
Use Comparable Windows Compare similar date ranges whenever possible and disclose when a test is imperfect.
3
Lead With 3–4 Metrics Spend, conversions/leads, cost per lead, and one supporting volume metric are usually enough.
4
Add CRM Outcomes Move toward qualified leads, appointments, jobs, and revenue when downstream tracking is available.
5
Archive the Proof Keep screenshots and explanations for retention, account reviews, case studies, and future sales.
Google Ads + HighLevel Agency FAQ

Questions Agencies Ask About Google Ads Budget Scaling

Straightforward answers to the budgeting, reporting, attribution, and SEO questions this case study raises.

Does increasing a Google Ads budget automatically increase spend?

No. The budget is a spending ceiling, not a guarantee that Google will use the full amount. Actual spend depends on eligible search demand, auction conditions, targeting, bidding, campaign status, conversion signals, and other factors. This case study demonstrates that directly: the second budget ceiling increased while actual spend in the comparison period was lower.

How do you know when a Google Ads campaign may be ready to scale?

A useful starting point is consistent conversion volume at a cost per lead or cost per acquisition the business can support. Agencies can then increase budget in controlled steps and watch whether additional spend produces more qualified opportunities without materially degrading acquisition cost. Historical account data is more useful than a generic rule.

What is the difference between Google Ads budget and actual spend?

Budget tells Google how much the campaign is allowed to spend within its budgeting rules. Actual spend is what the platform really used. A campaign can remain under budget when available traffic, targeting, auction conditions, bidding, or other constraints prevent the system from using the entire ceiling.

Can Google Ads and Local Services Ads cost per lead be compared directly?

They can be compared directionally, but they are not perfectly identical metrics. In this report, Google Ads uses tracked conversions while Local Services Ads uses charged phone and message leads. Agencies should compare downstream lead quality, appointments, sales, and revenue when those data points are available.

Are the Google Ads results in this case study SEO results?

No. Google Ads and Local Services Ads are paid acquisition channels. They do not prove organic rankings, HighLevel website rankings, Google Business Profile rankings, or SEO performance. They are included because paid media reporting helps agencies understand the complete client acquisition picture and can complement a long-term organic strategy.

How can Google Ads complement SEO for a HighLevel website?

Paid search can create immediate visibility and conversion data while SEO develops. A HighLevel website can serve as the landing and conversion asset for both channels when it is structured well, tracks forms and calls correctly, and includes useful service and location content. Over time, stronger organic visibility may reduce reliance on paid traffic, although profitable paid campaigns can still remain valuable.

Can a website built in HighLevel rank organically in Google?

Yes. A HighLevel website can be crawled and indexed when it is published correctly and can compete in organic search when it has useful content, sound site structure, internal linking, metadata, schema, mobile usability, backlinks and other relevant SEO signals. HighLevel itself does not guarantee rankings; execution and competition still matter.

What is the best way to report Google Ads results to clients?

Keep the client-facing summary simple: what changed, how much was actually spent, how many leads or conversions were tracked, what happened to cost per lead, and what the agency recommends next. Keep screenshots and deeper platform data available as evidence, then connect campaign conversions to CRM outcomes whenever possible.

What does the free Google Ads Budget Calculator do?

The calculator helps model a potential advertising budget using inputs such as cost per click, conversion rate, cost per lead, and desired lead volume. It is a planning tool rather than a forecast guarantee. Real account data should replace assumptions as the campaign collects enough performance history.

See More Real Reports—or Build Better Reporting Into Your Agency

Browse more anonymized GHL Meets SEO case studies, join the email list for new reports and Agent updates, or explore the White Label Partner model for HighLevel-native website and SEO fulfillment.