Get notified when we publish new
case studies, SEO reports, Agent features,
strategies, updates, and other resources built specifically
for HighLevel agencies.
✓
New Case Studies
✓
Agent Releases + Updates
✓
SEO Reports + Findings
Enter your information below to join the list
↓
Stay in the Loop
What You’ll Get
1
New Results + Case Studies
See new rankings, traffic, website, local SEO,
and client-result examples as we publish them.
2
New Agent Features
Get updates when we release new GHL Zone Agents,
workflows, capabilities, and improvements.
3
SEO Strategies + Reports
Get practical findings, tests, strategies, and
resources built around SEO with HighLevel.
Join for updates from GHL Meets SEO. You can unsubscribe
from marketing emails at any time.
In Parker, Colorado, the “Roof Replacement Parker” local grid improved from 86.85 to 95.50 Share of Local Voice, while “Parker Roofing Contractor” expanded top-three coverage from 4.15 to 26.64. Website search growth moved at the same time: the latest six-month Search Console period recorded 348 clicks and 166K impressions versus 90 clicks and 40.6K impressions in the previous six months, with average position improving from 16.3 to 9.9.
Local SEO + Website Growth Case Study
Google Business Profile + Website Report:
Roofing Contractor in Parker, CO
This roofing case study combines two kinds of organic search evidence that are often reviewed separately: Google Business Profile visibility across Parker-area map grids and Google Search Console growth from the website. The report shows where local Map Pack coverage strengthened between June and August 2026, then adds an eight-month website view and a six-month comparison to show how the site's broader organic footprint was changing at the same time.
A consolidated view of local Google Maps visibility and organic website search growth for a roofing contractor serving Parker, Colorado and the surrounding market.
Industry: RoofingMarket: Parker, ColoradoLocal: Google Maps / GBPWebsite: Google Search ConsoleData Through: Aug. 28, 2026
Roof Replacement SoLV95.50
Contractor SoLV Gain+22.49
Latest 6-Mo. Clicks348
Latest 6-Mo. Avg. Position9.9
Section 01 · Google Maps Visibility
Matched Search-Grid Comparisons
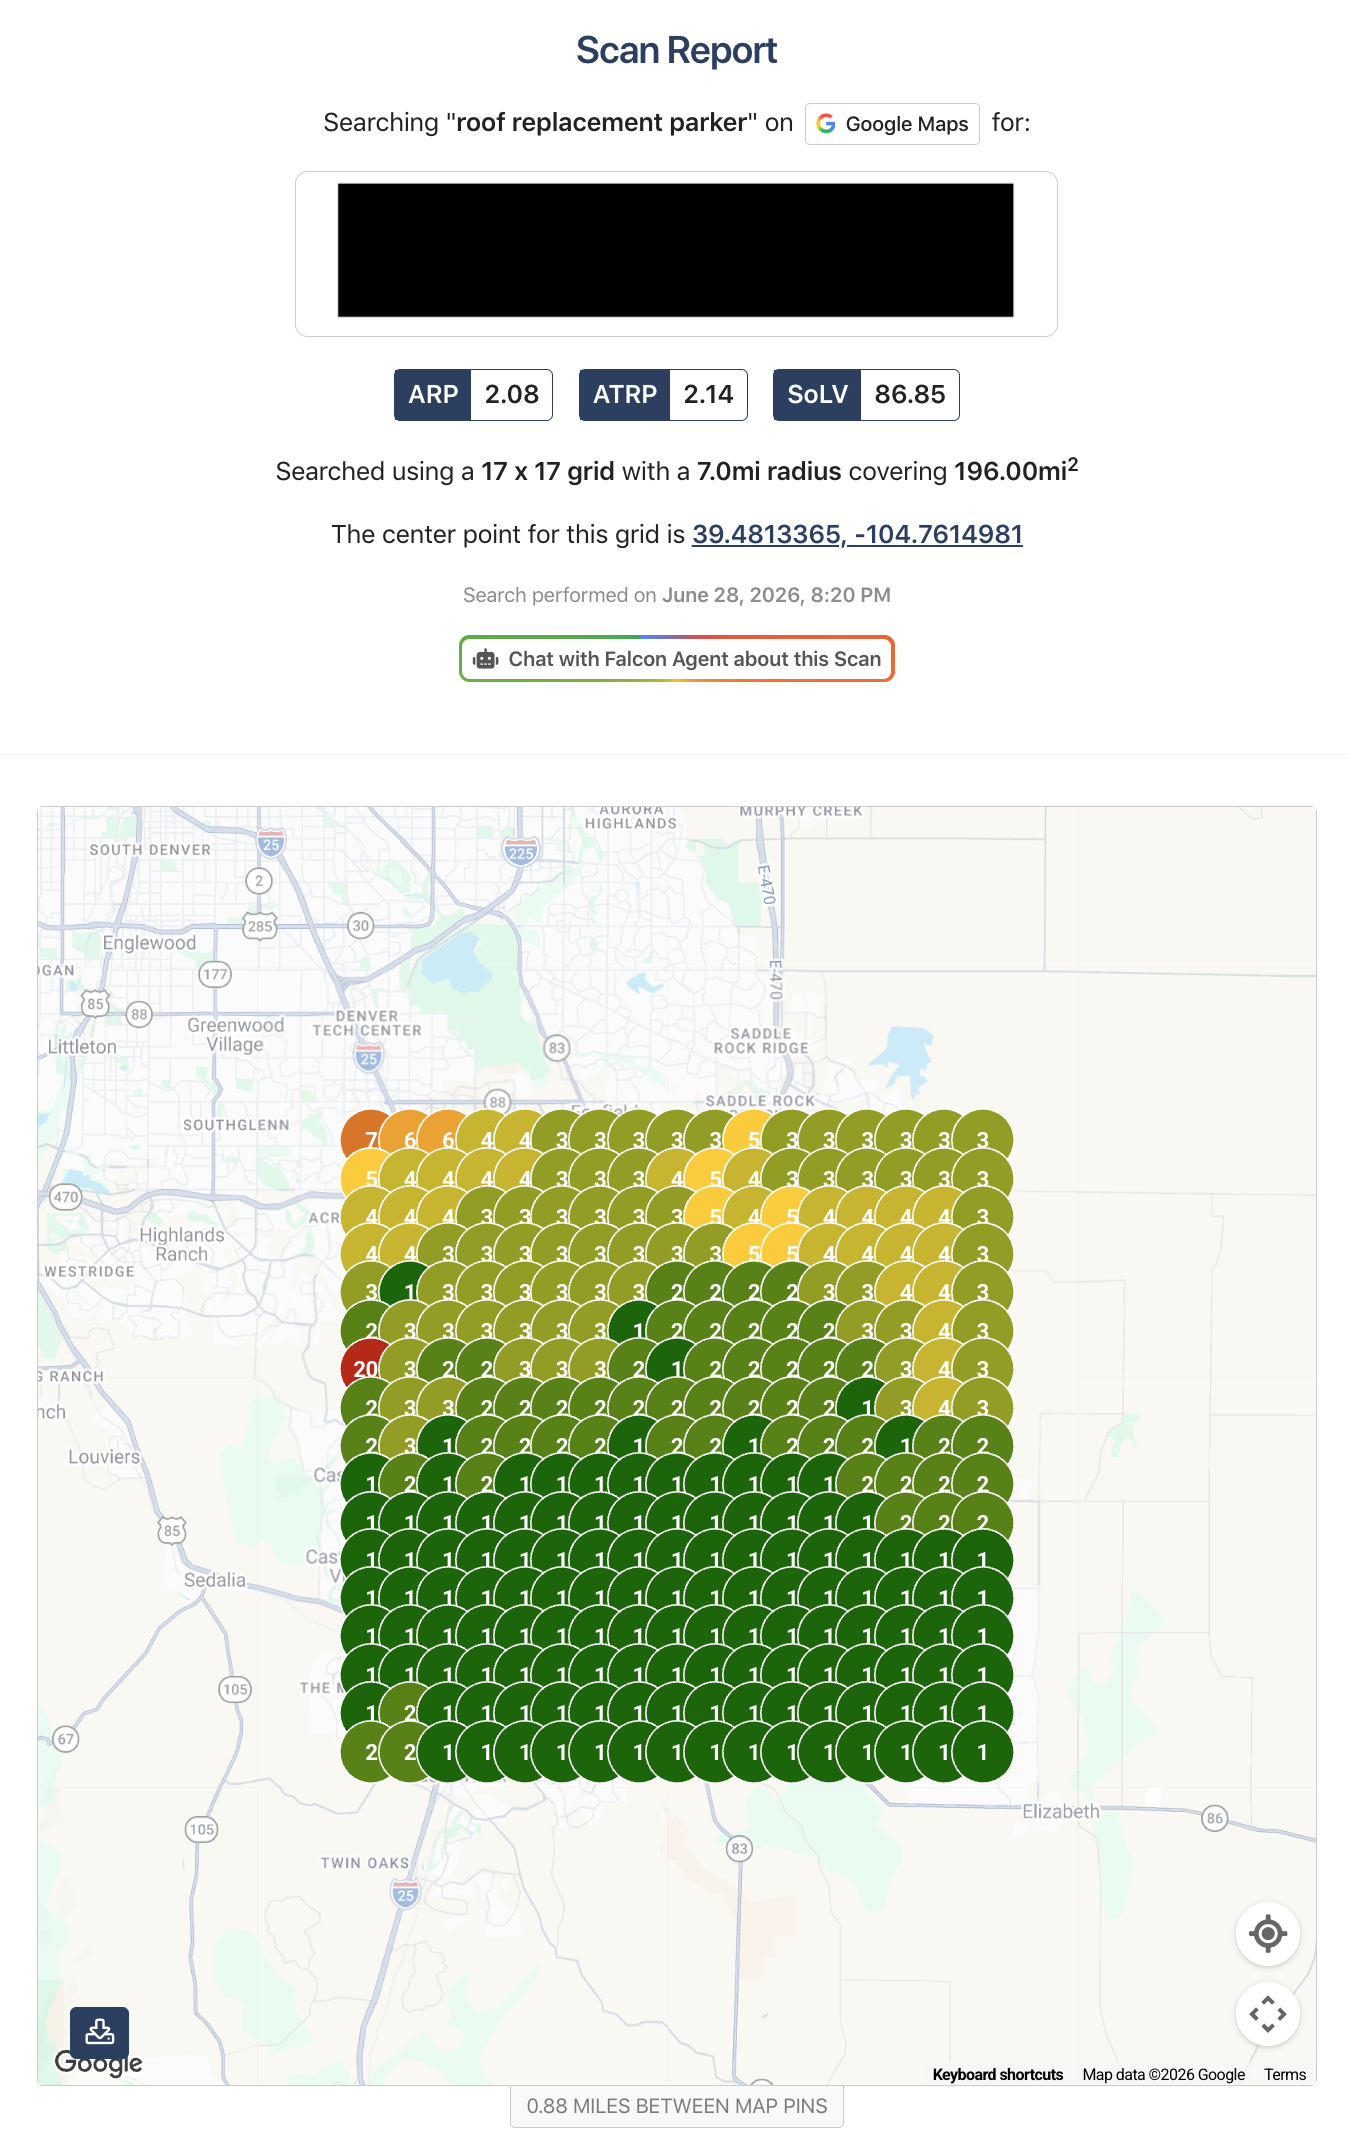
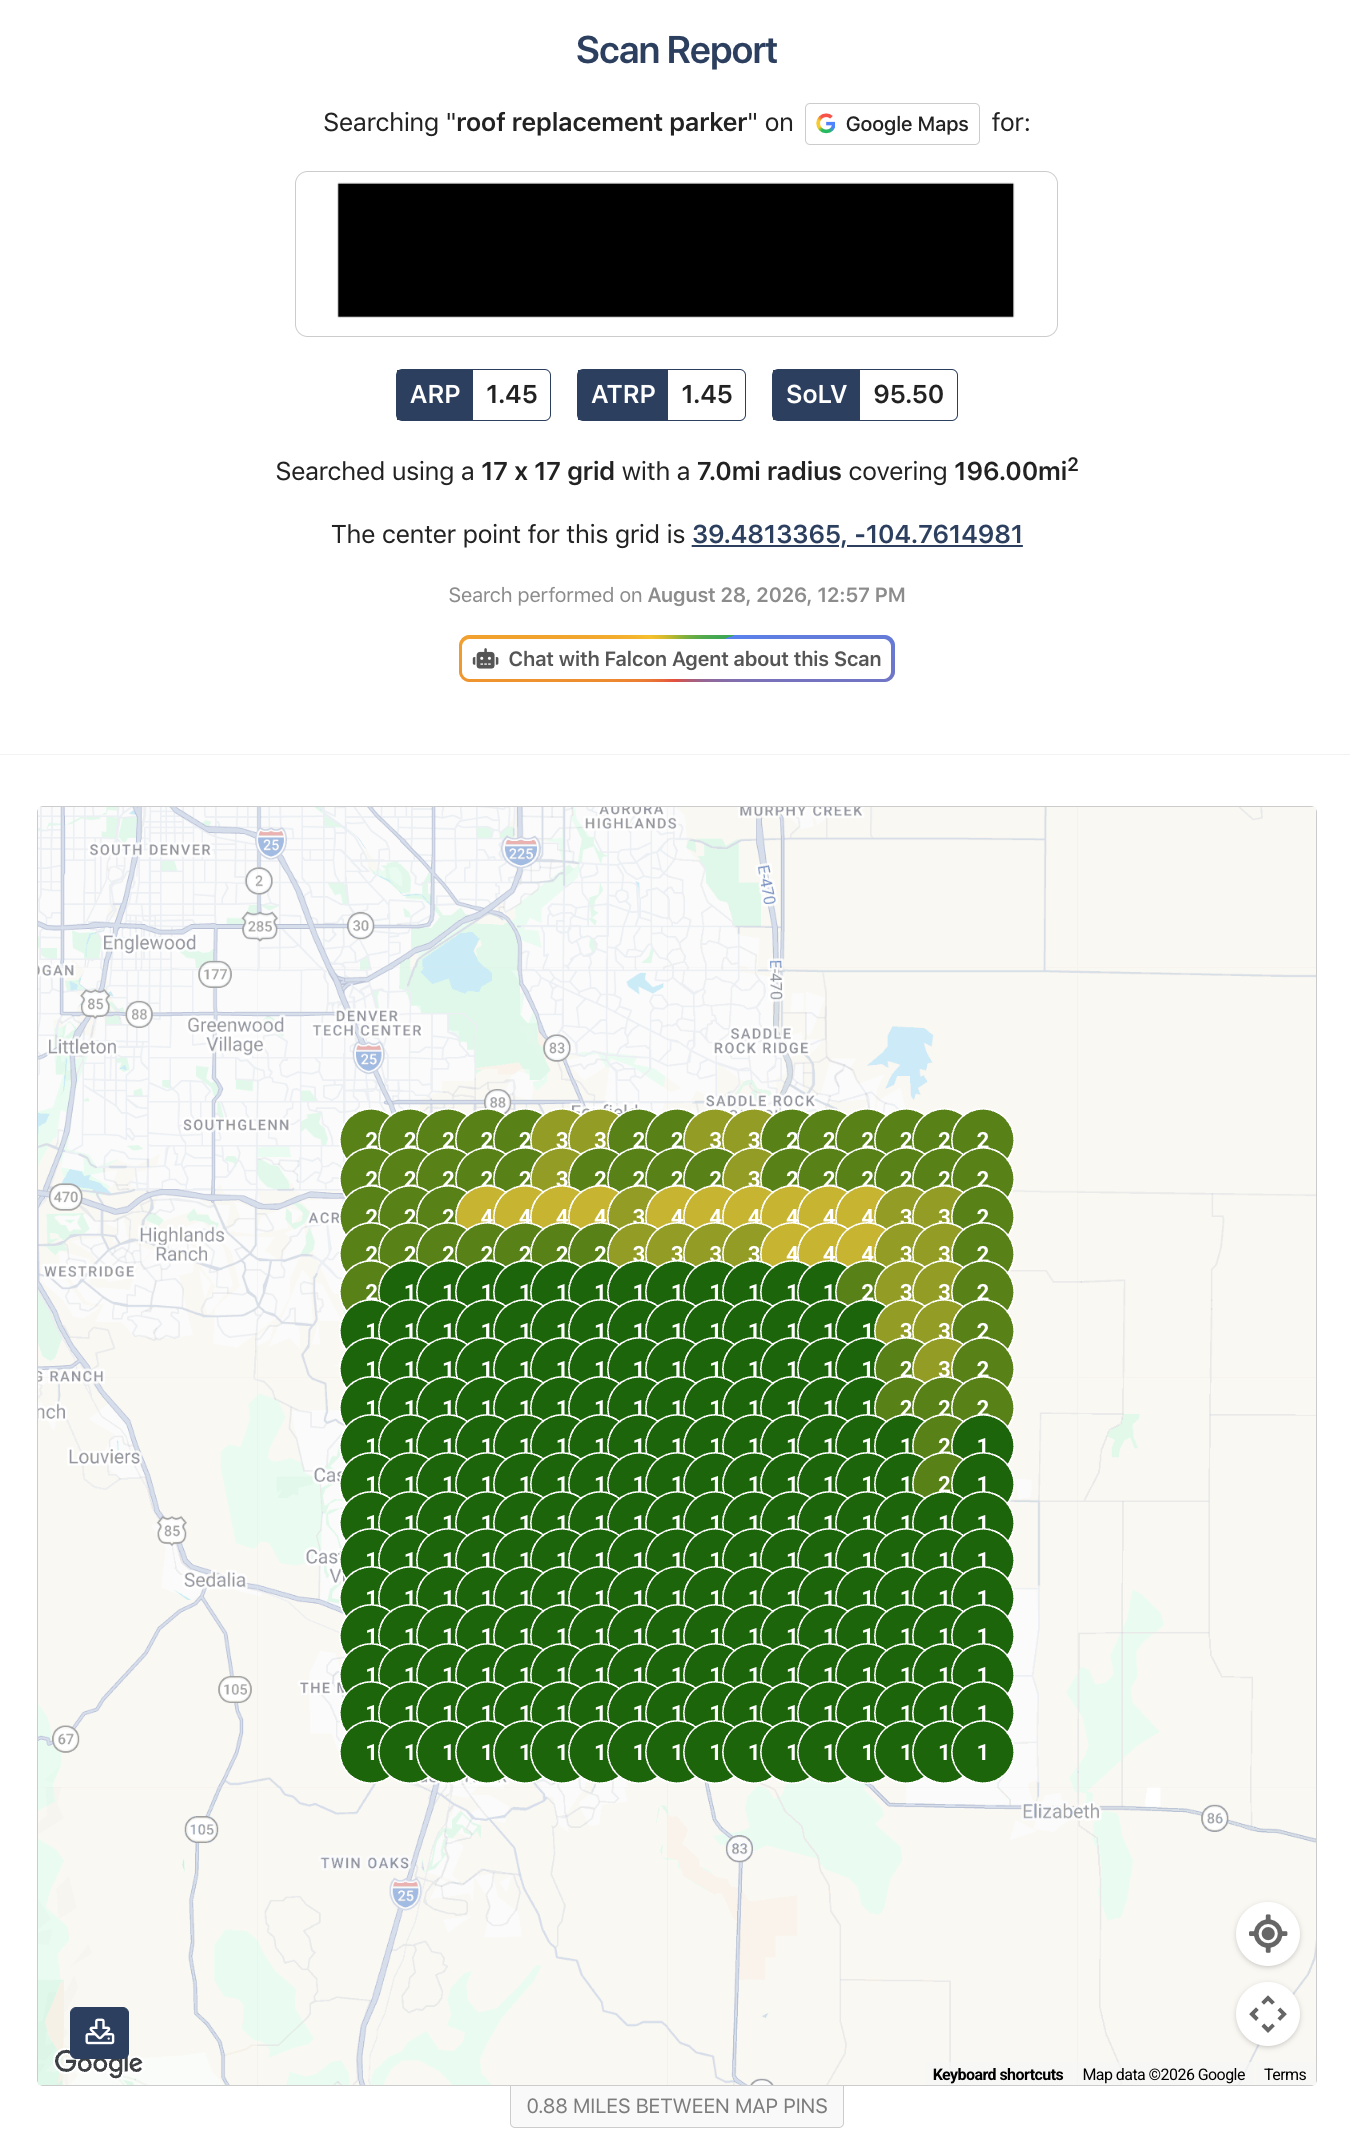
The first two sets use the same search term, the same 17 × 17 grid, the same 7-mile radius, and the same Parker-centered scan area. That makes the June 28 and August 28 screenshots useful directional comparisons of local visibility over time.
Standard scan footprint:
Each grid contains 289 search points across a 7-mile radius / 196-square-mile area. Lower ARP and ATRP are better; higher Share of Local Voice means the profile appears in the top three at more tested locations.
Search Term: Roof Replacement Parker
Top-Three Coverage Was Already Strong—and Became More Consistent
This term started with broad Map Pack coverage in June. By August, the remaining weaker pockets contracted and average position moved closer to the top spot across the full grid.
Jun. 28 → Aug. 28, 2026
ARP2.08 → 1.45
0.63-position improvement
ATRP2.14 → 1.45
0.69-position improvement
Share of Local Voice86.85 → 95.50
+8.65 percentage points
June 28, 2026
ARP 2.08ATRP 2.14SoLV 86.85
Search Term: Roof Replacement Parker
Click to Zoom
August 28, 2026
ARP 1.45ATRP 1.45SoLV 95.50
Search Term: Roof Replacement Parker
Click to Zoom
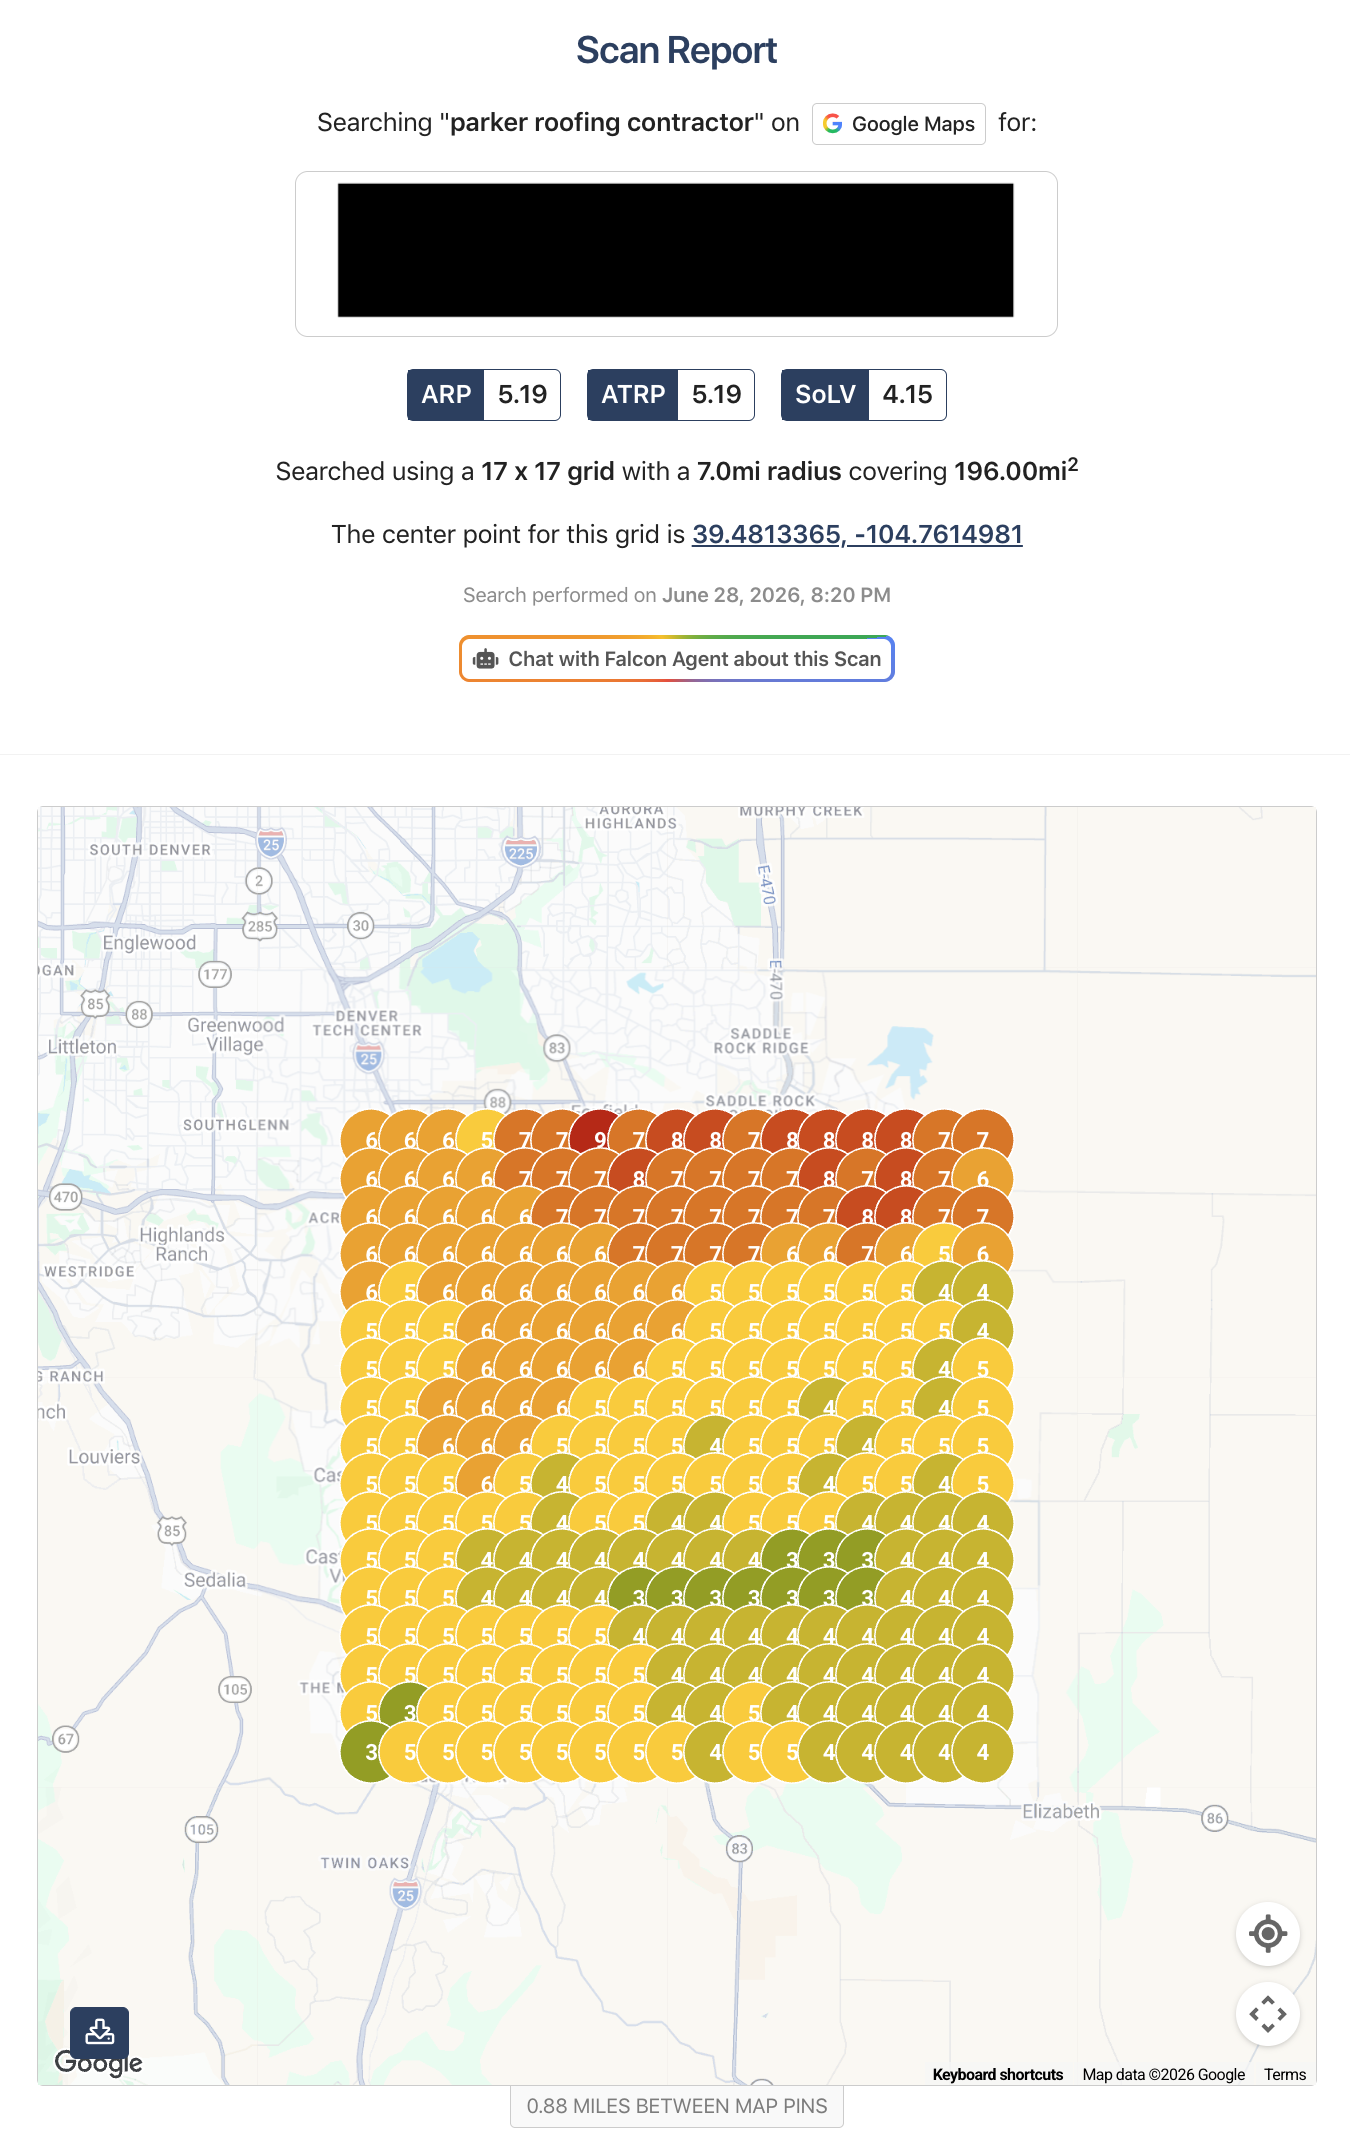
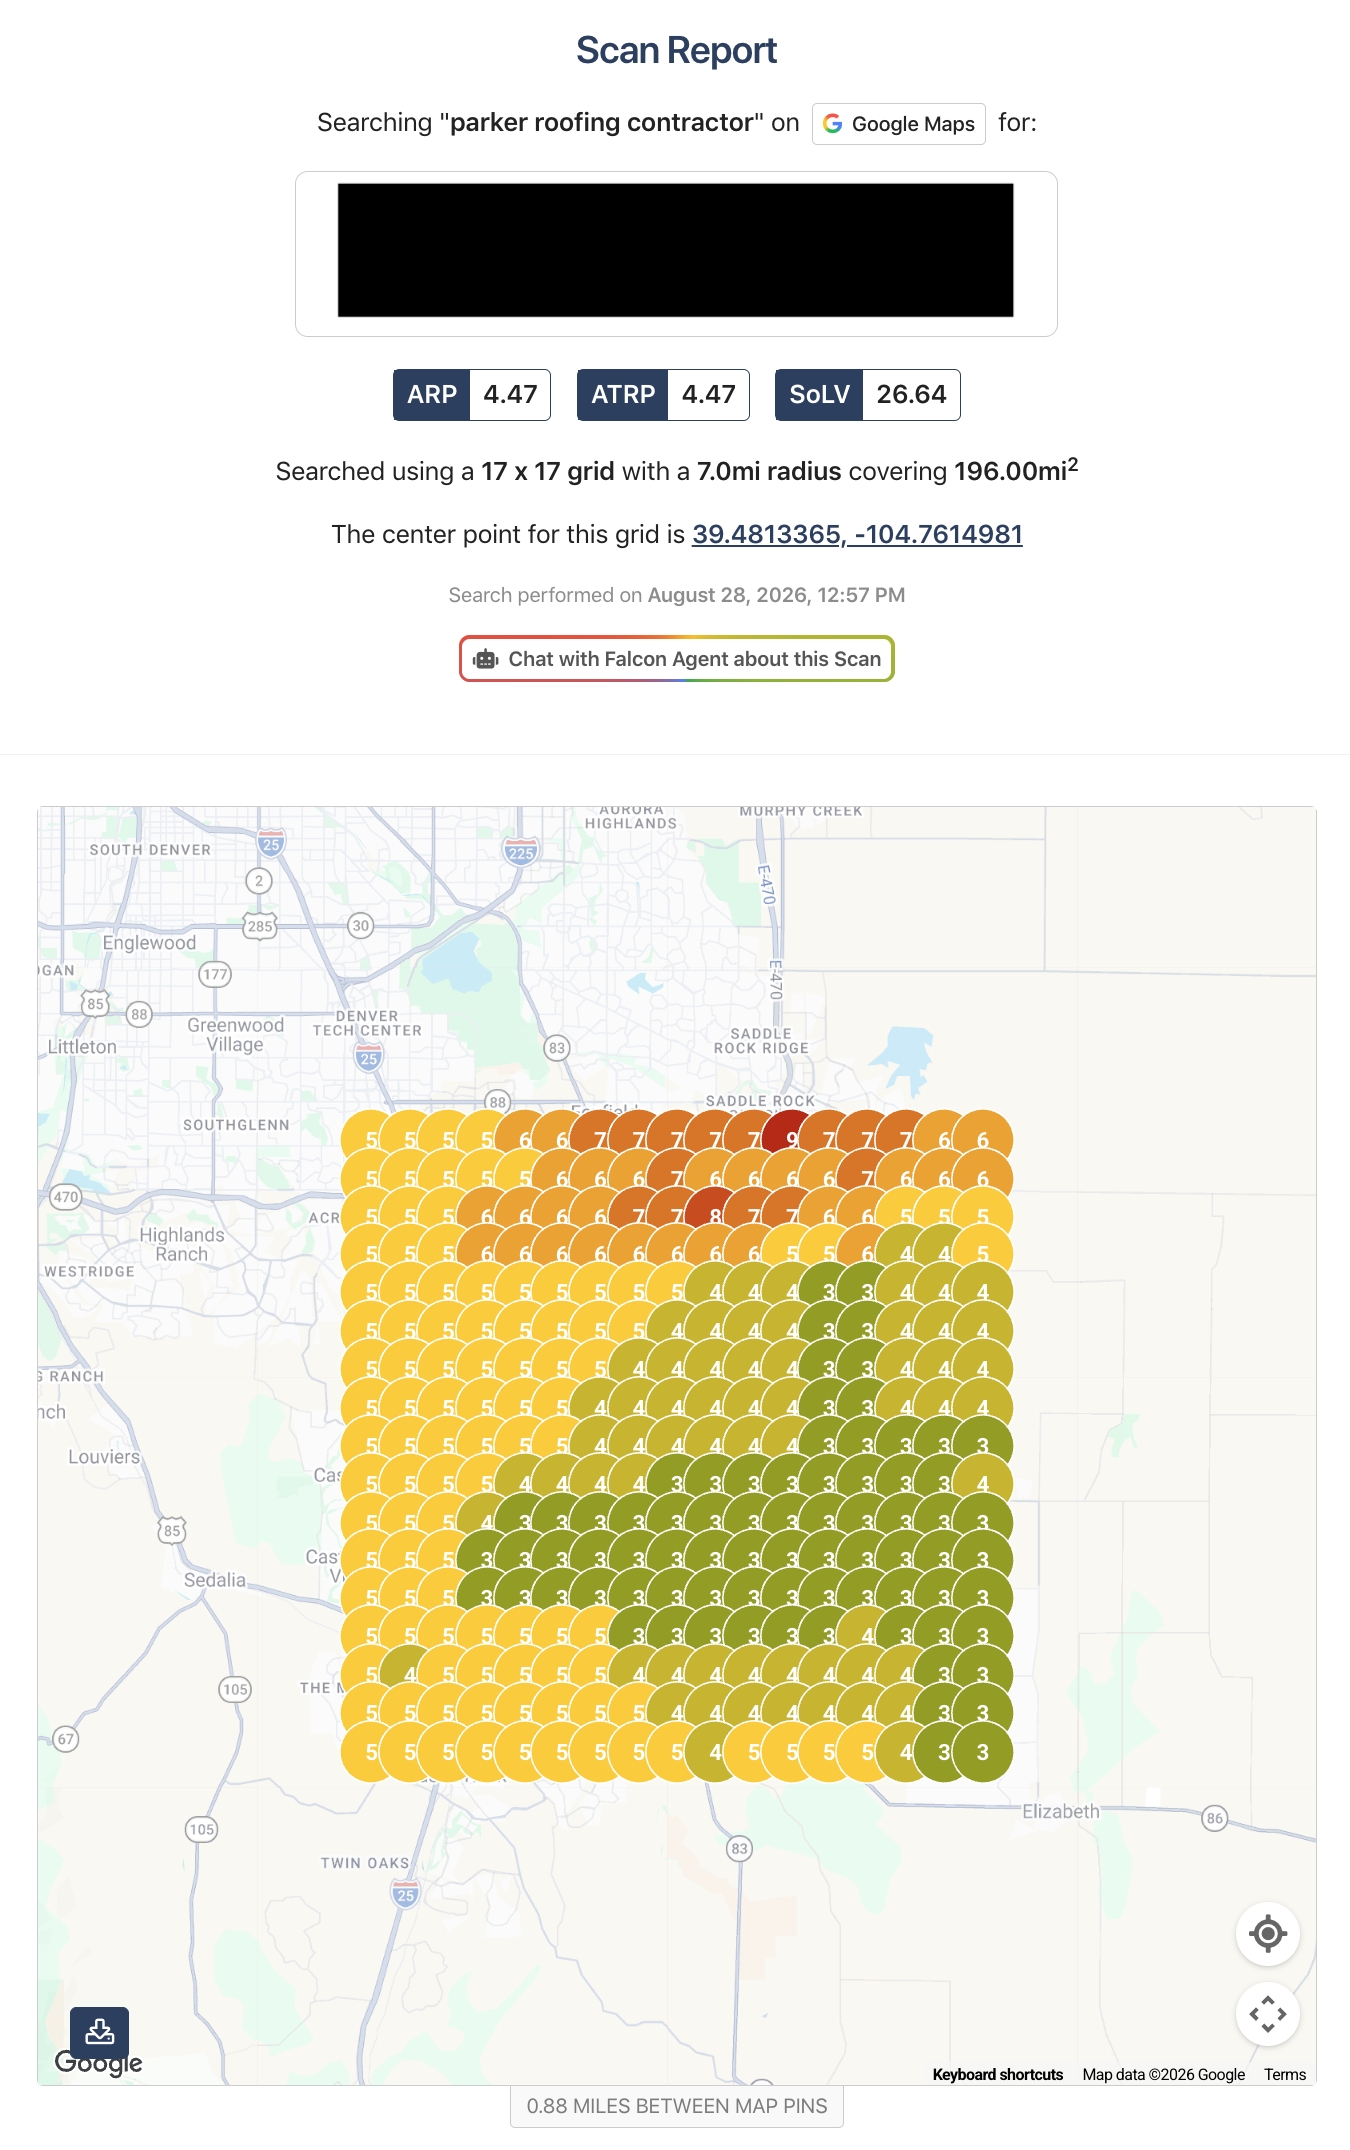
Search Term: Parker Roofing Contractor
A Smaller Ranking Move Produced a Much Larger Map Pack Footprint
Average position improved modestly, but Share of Local Voice changed much more dramatically. That indicates a growing number of search points moved into positions 1–3 even though the full-grid average still had room to improve.
Jun. 28 → Aug. 28, 2026
ARP5.19 → 4.47
0.72-position improvement
ATRP5.19 → 4.47
0.72-position improvement
Share of Local Voice4.15 → 26.64
+22.49 points / about 6.4×
June 28, 2026
ARP 5.19ATRP 5.19SoLV 4.15
Search Term: Parker Roofing Contractor
Click to Zoom
August 28, 2026
ARP 4.47ATRP 4.47SoLV 26.64
Search Term: Parker Roofing Contractor
Click to Zoom
Section 02 · Additional Local Searches
Two More Parker Roofing Queries
These scans add breadth to the local picture by showing two additional ways a homeowner might search for a roofing company.
Do not read these two screenshots as a before-and-after comparison.
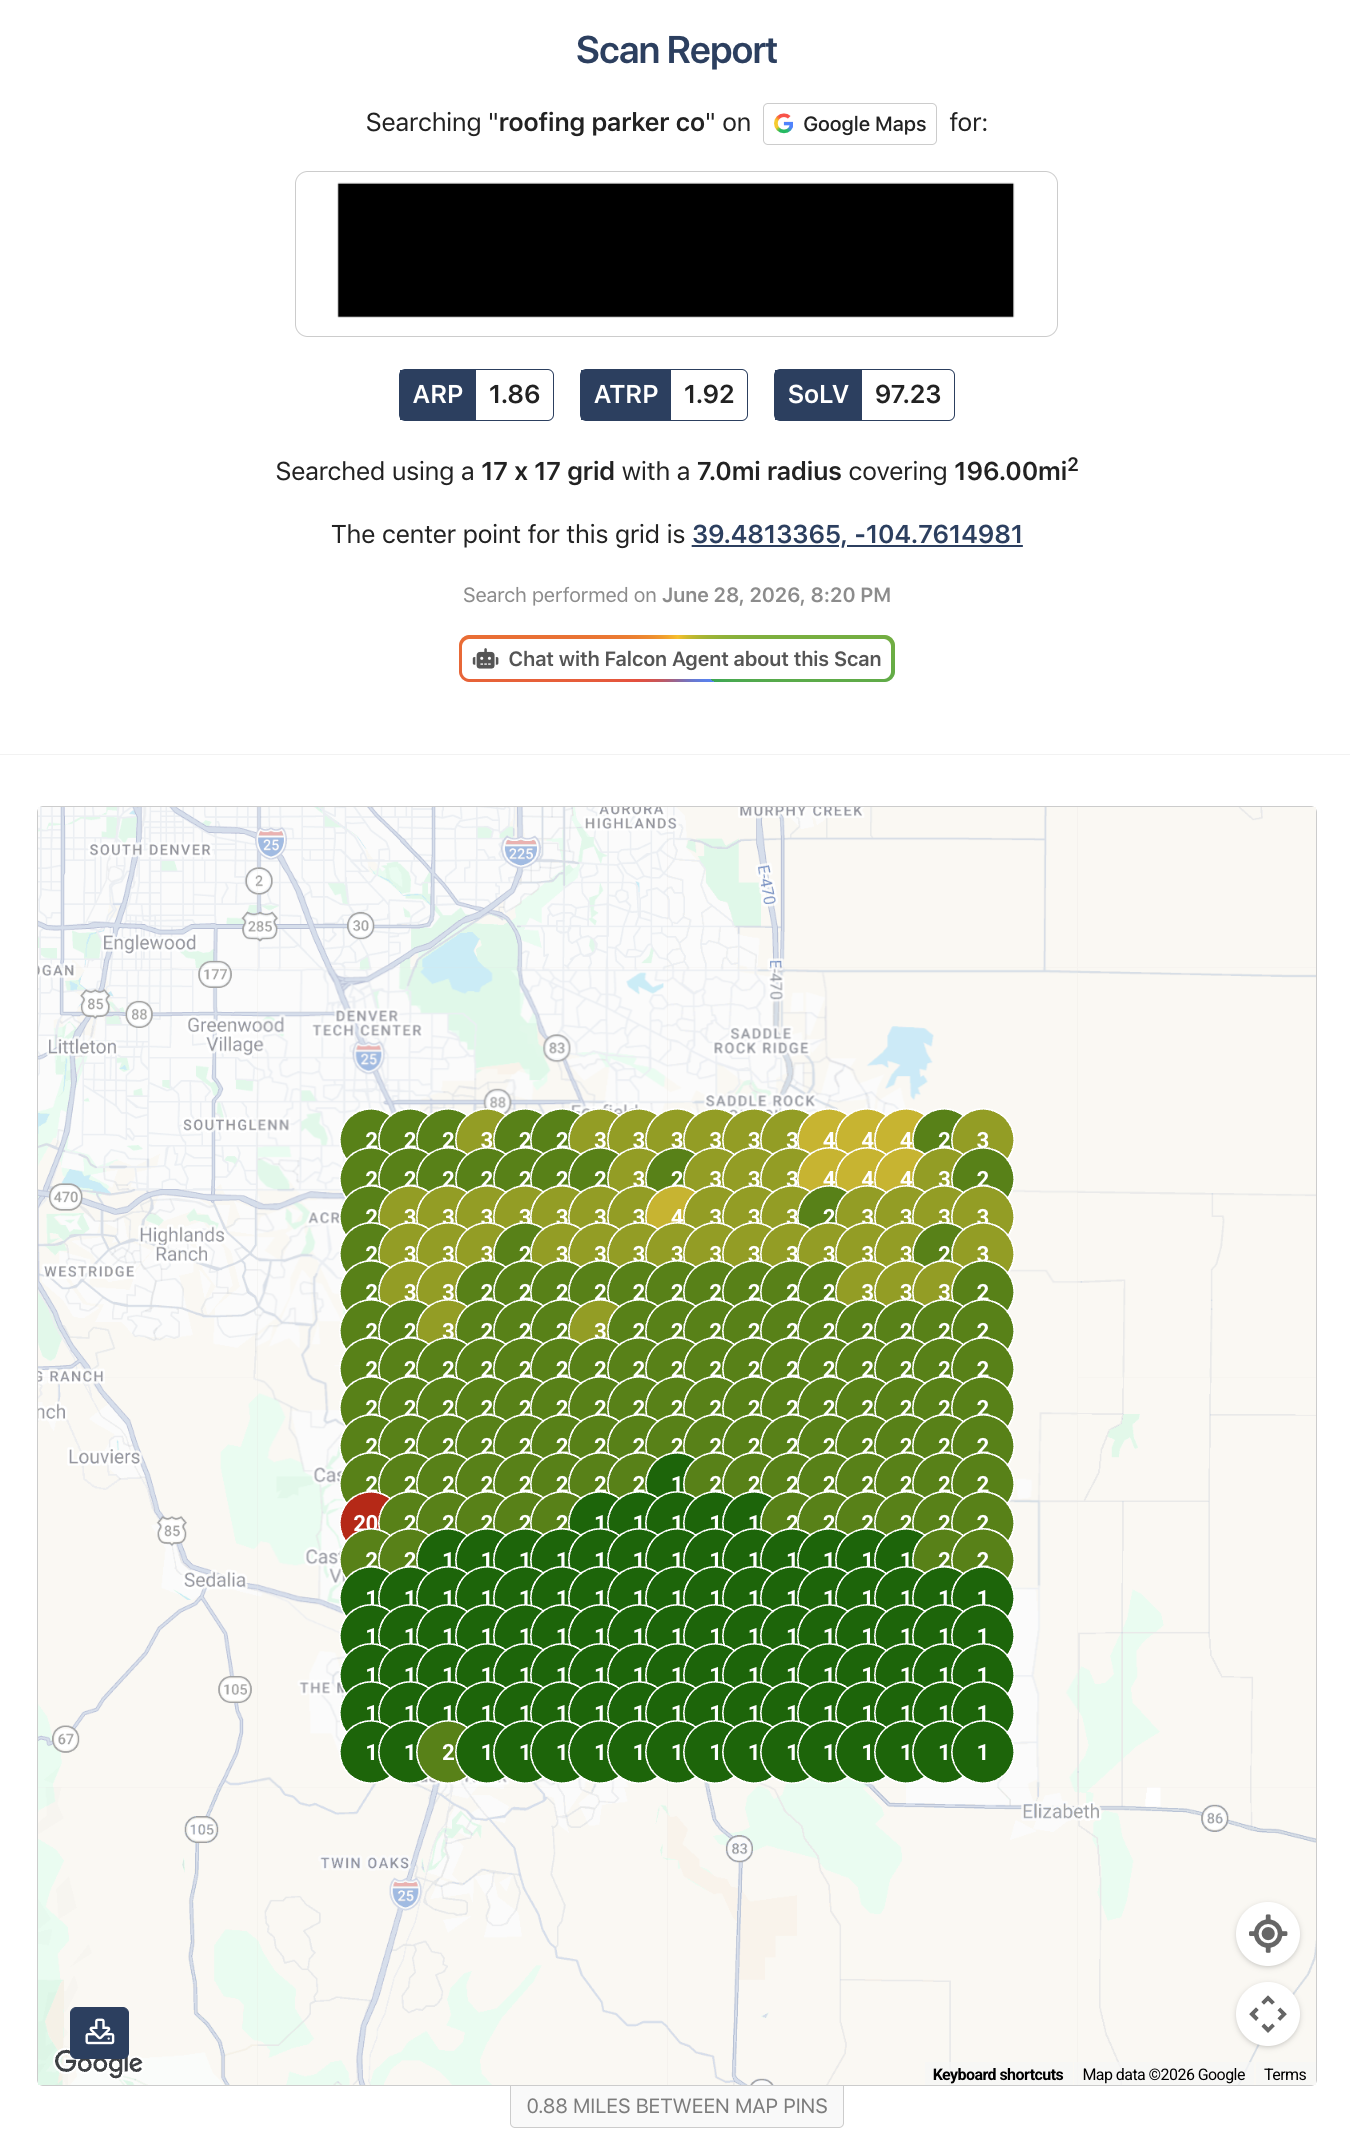
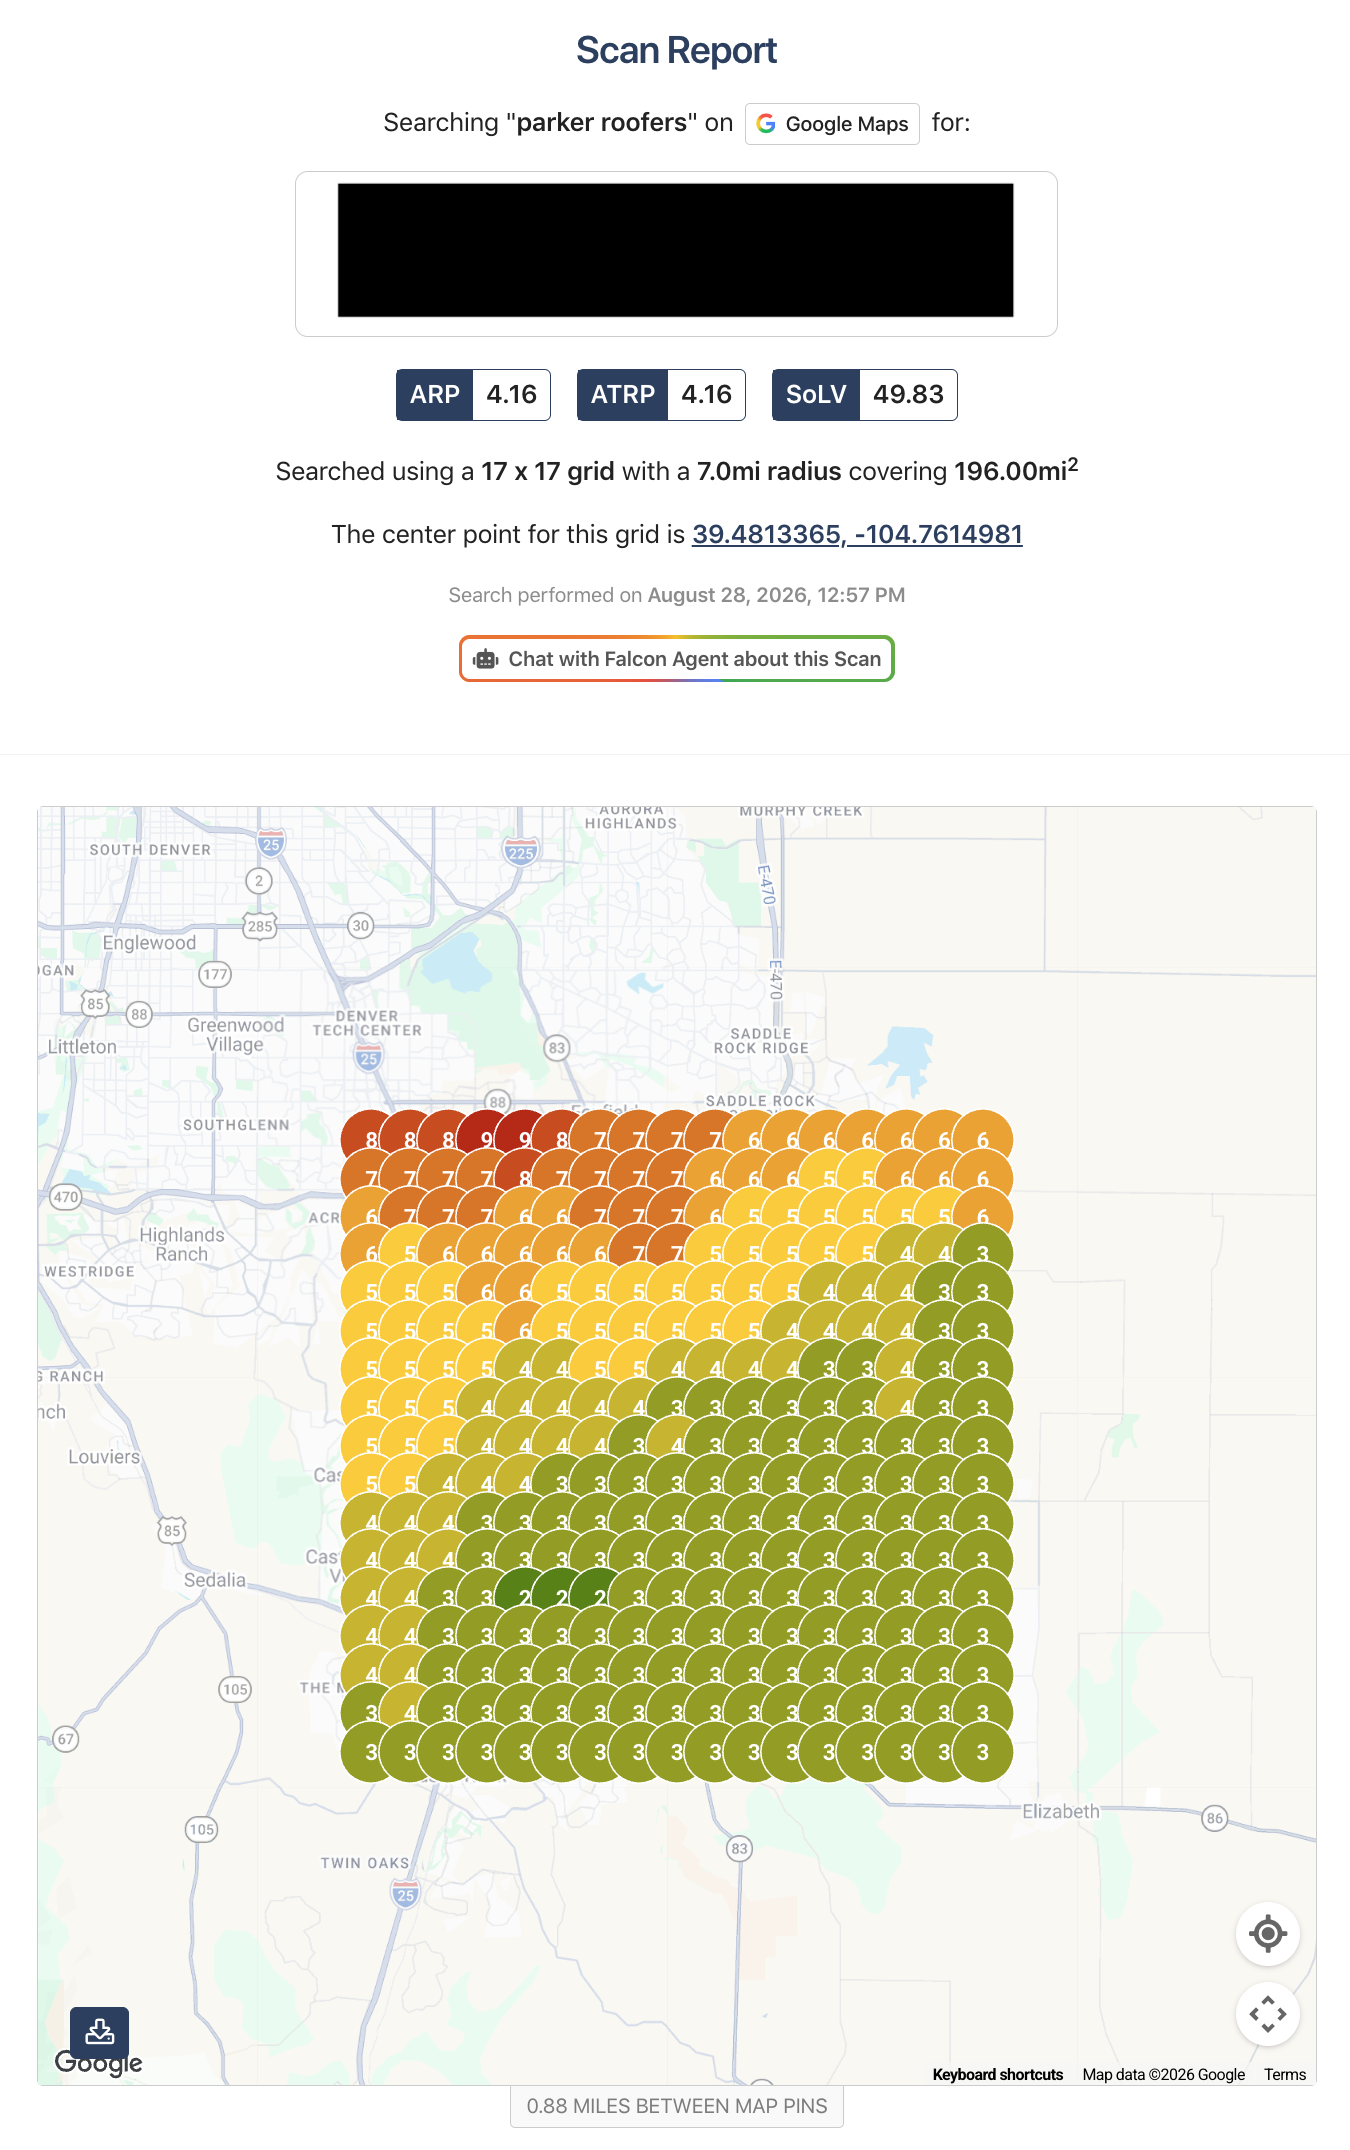
They use different search terms and were captured on different dates. They are shown side by side only to illustrate how ranking strength can vary from one roofing query to another.
Search Term: Roofing Parker CO
June 28, 2026
ARP 1.86ATRP 1.92SoLV 97.23
Search Term: Roofing Parker CO
Click to Zoom
Search Term: Parker Roofers
August 28, 2026
ARP 4.16ATRP 4.16SoLV 49.83
Search Term: Parker Roofers
Click to Zoom
Section 03 · Reading Local Rankings
Why Positions 1–3 Matter on a Roofing Search Grid
Every grid number represents the Google Business Profile's organic local position when the same search is performed from that map point. The most important threshold is the move into positions 1–3, because those listings normally occupy Google's primary Map Pack.
From a Grid Number to a Search Result
A roofing company can rank first a few blocks from its location and several positions lower farther across the market. The grid makes that geographic change visible instead of reducing local rankings to one number from one address.
1–3
Primary Map Pack Visibility
These positions are normally visible in Google's first local result set without requiring the searcher to open the larger list.
4+
Ranking, but Outside the First Three
The profile is still being found, but additional improvement may be needed before it appears in the primary Map Pack at that search point.
Why use a large 196-square-mile grid for roofing?
Roofing companies often serve a market much larger than the blocks immediately surrounding the office. A 7-mile radius tests whether local visibility holds together as searches move through Parker and toward the edges of the service market.
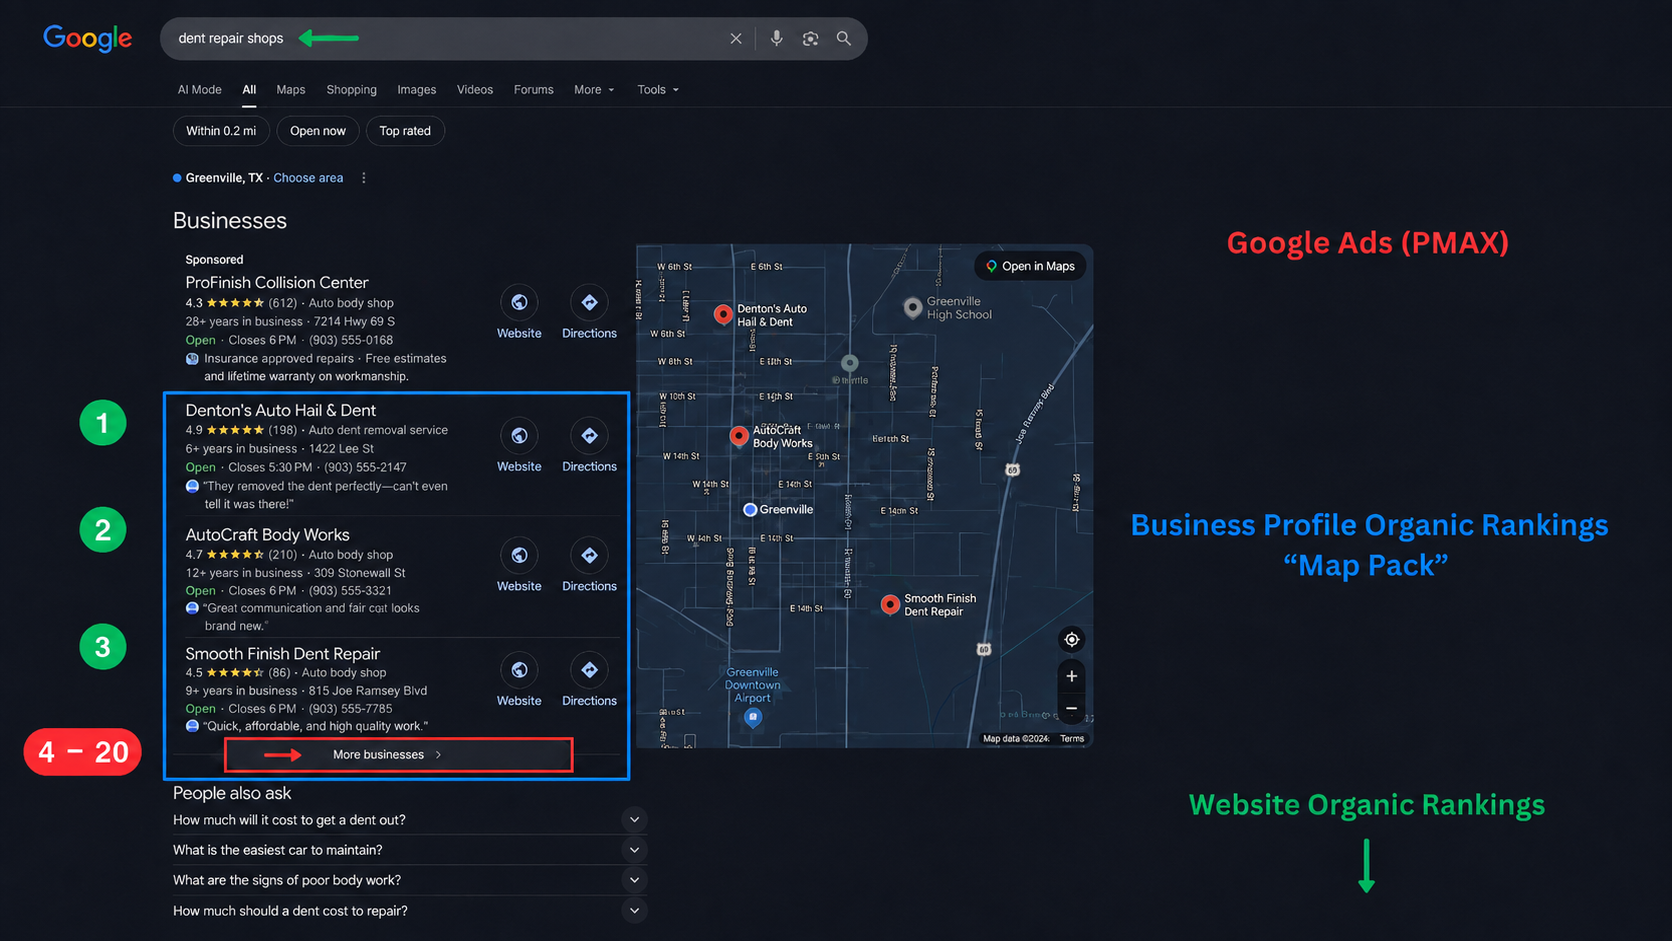
Map Pack example: Google Business Profile positions 1–3 are separate from paid Google Ads and from the website's standard organic rankings.
Section 04 · Website Organic Search
Google Search Console Website Growth
The local grids show Google Business Profile visibility. Search Console measures a different organic asset: how the website appears and earns clicks in Google's standard search results.
Eight-Month Website View
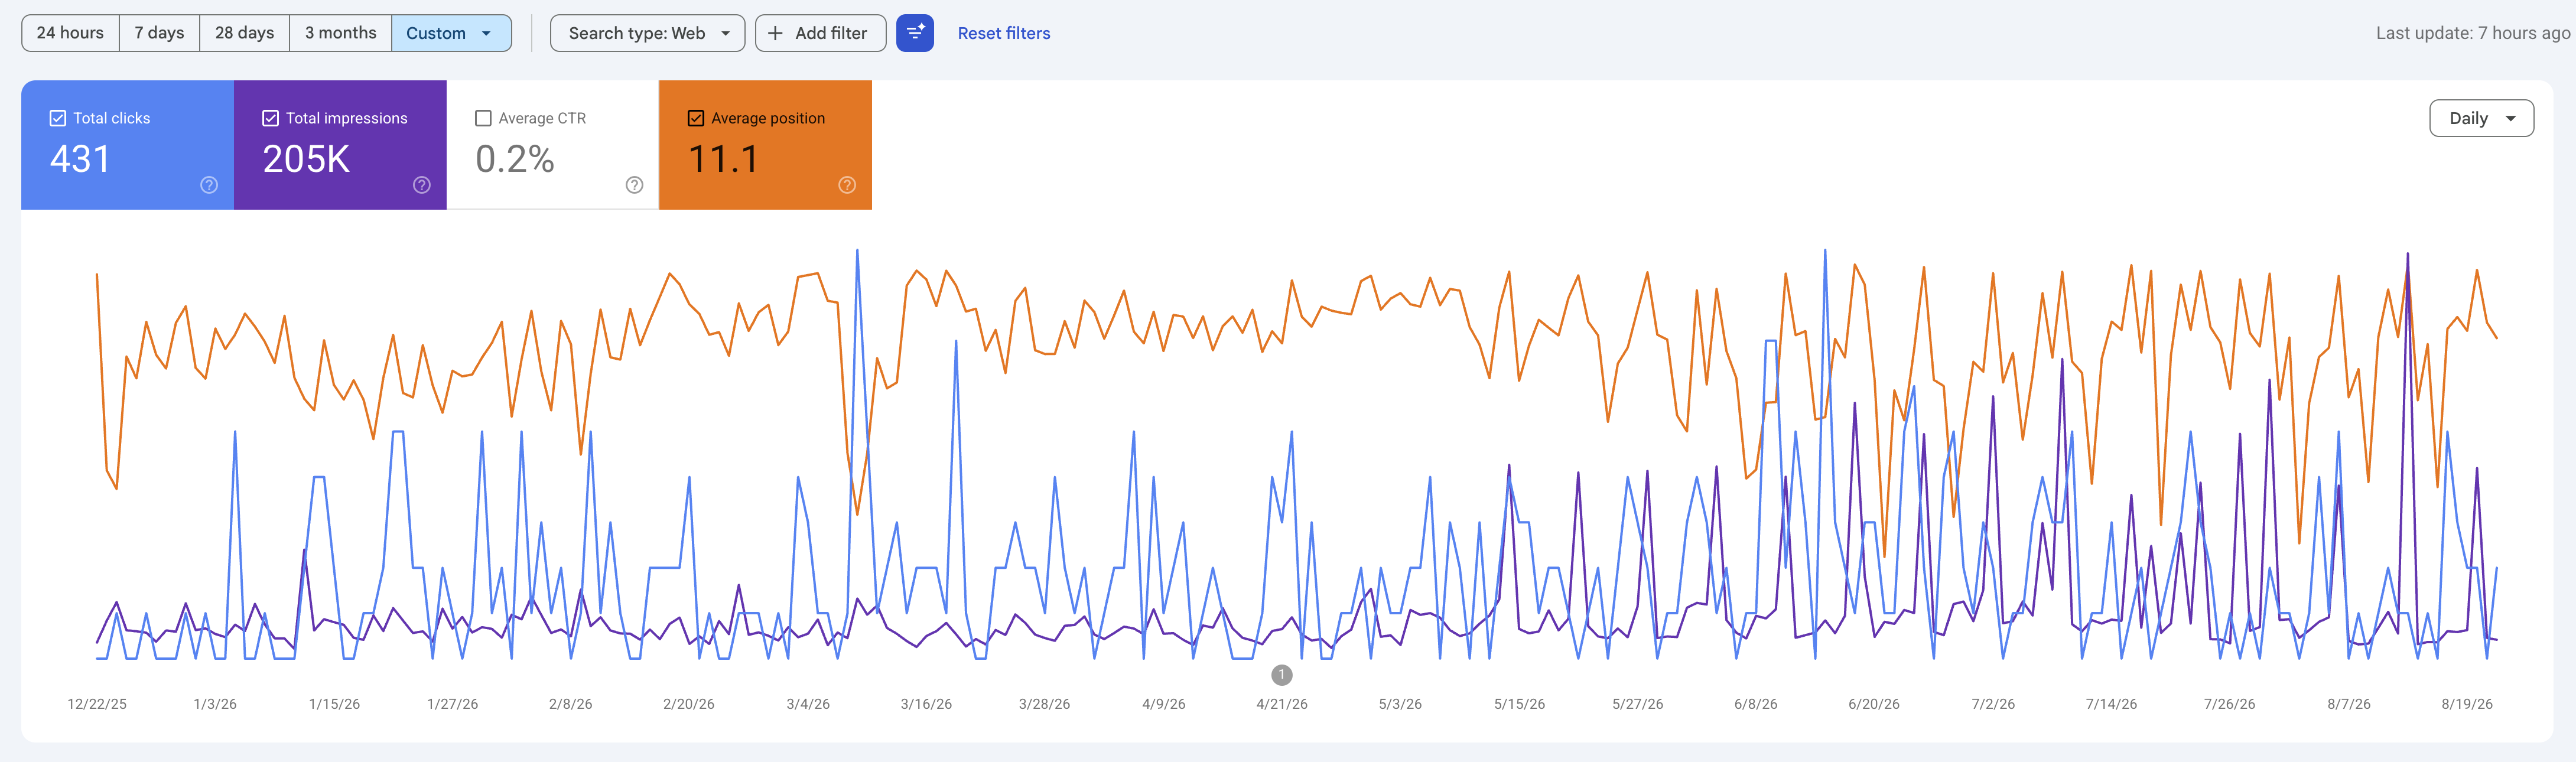
Across the eight-month view shown in Search Console, the website accumulated 431 organic clicks and about 205,000 impressions.
Total Clicks431
Total Impressions205K
Average CTR0.2%
Average Position11.1
Google Search Console · Eight-Month Traffic Trend
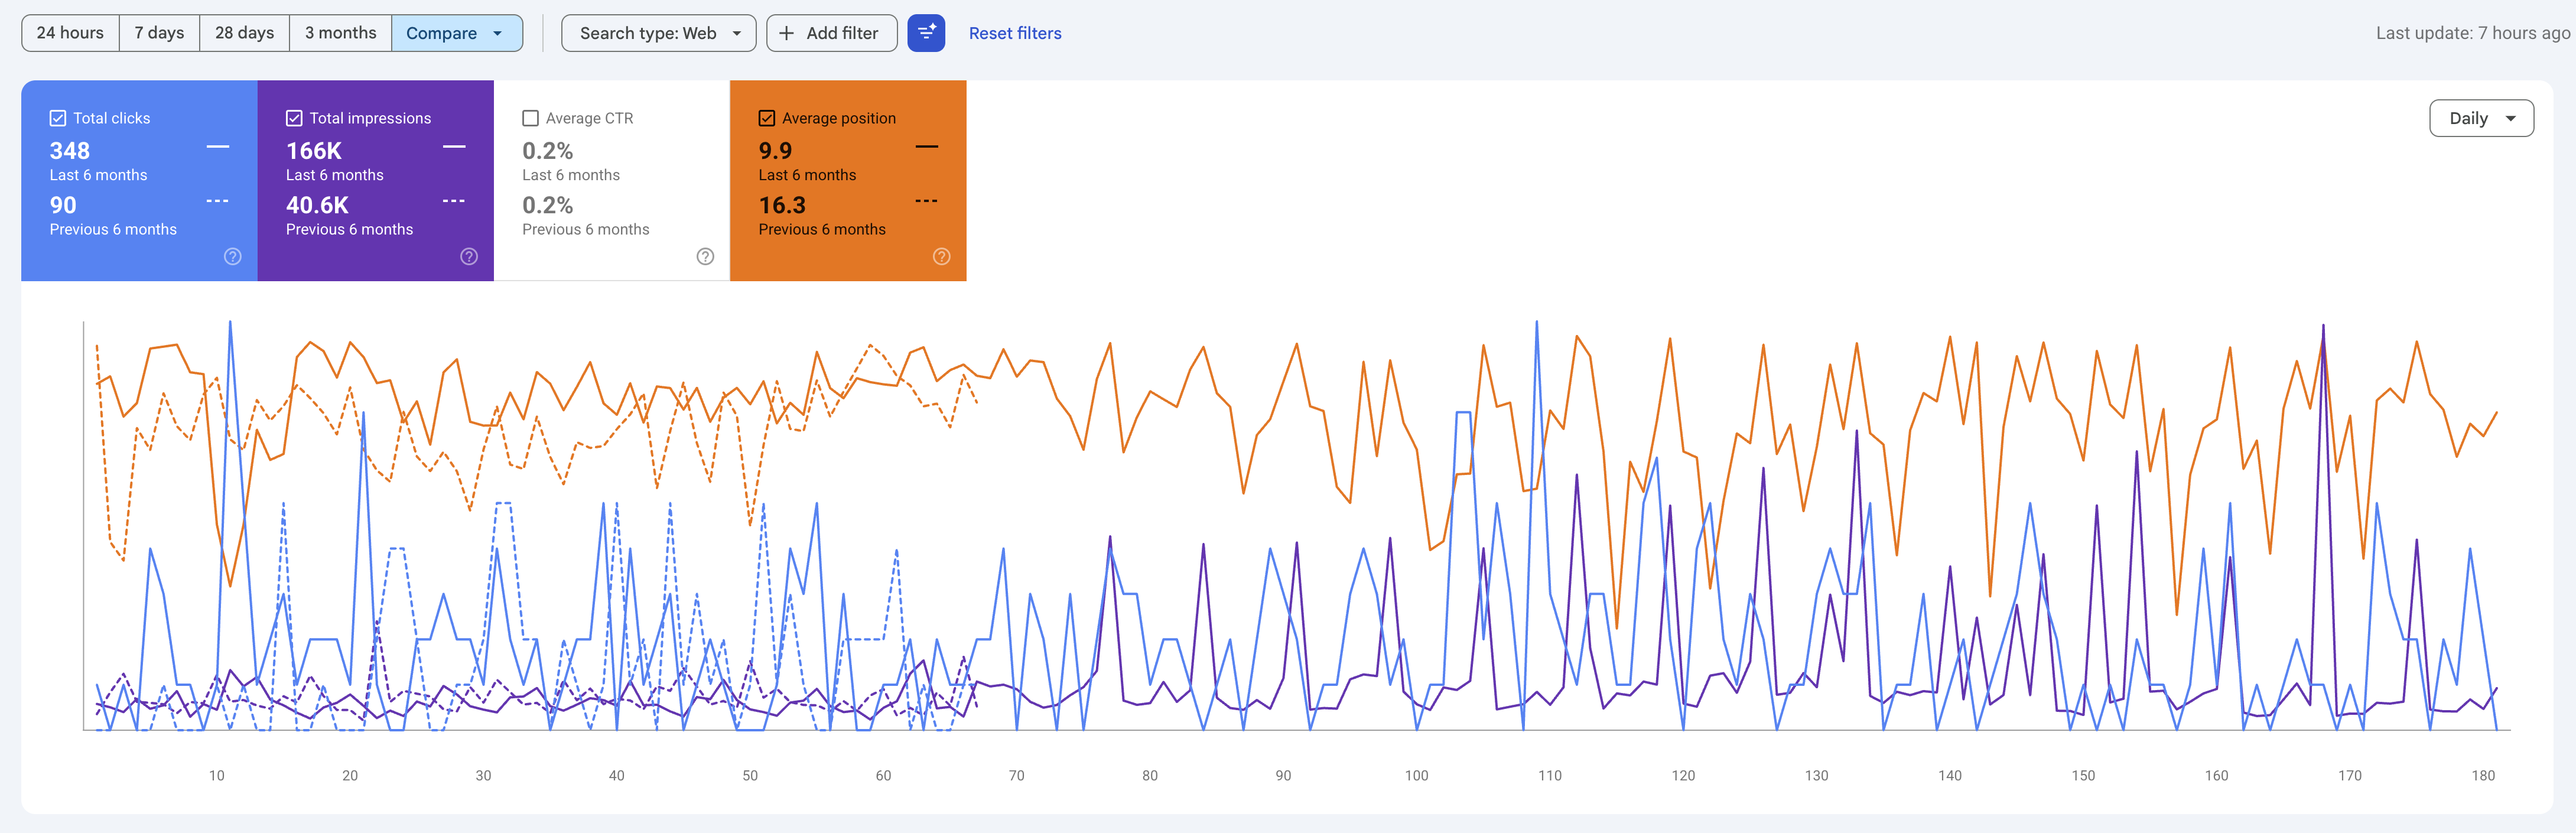
Latest Six Months vs. Previous Six Months
The comparison view shows a much larger organic search footprint in the latest period. Click-through rate stayed at 0.2%, while impressions, clicks, and average position changed substantially.
Organic Clicks90 → 348
+258 clicks / about +287%
Search Impressions40.6K → 166K
More than 4× the prior visibility
Average Position16.3 → 9.9
6.4-position improvement
Google Search Console · Six-Month Traffic Comparison
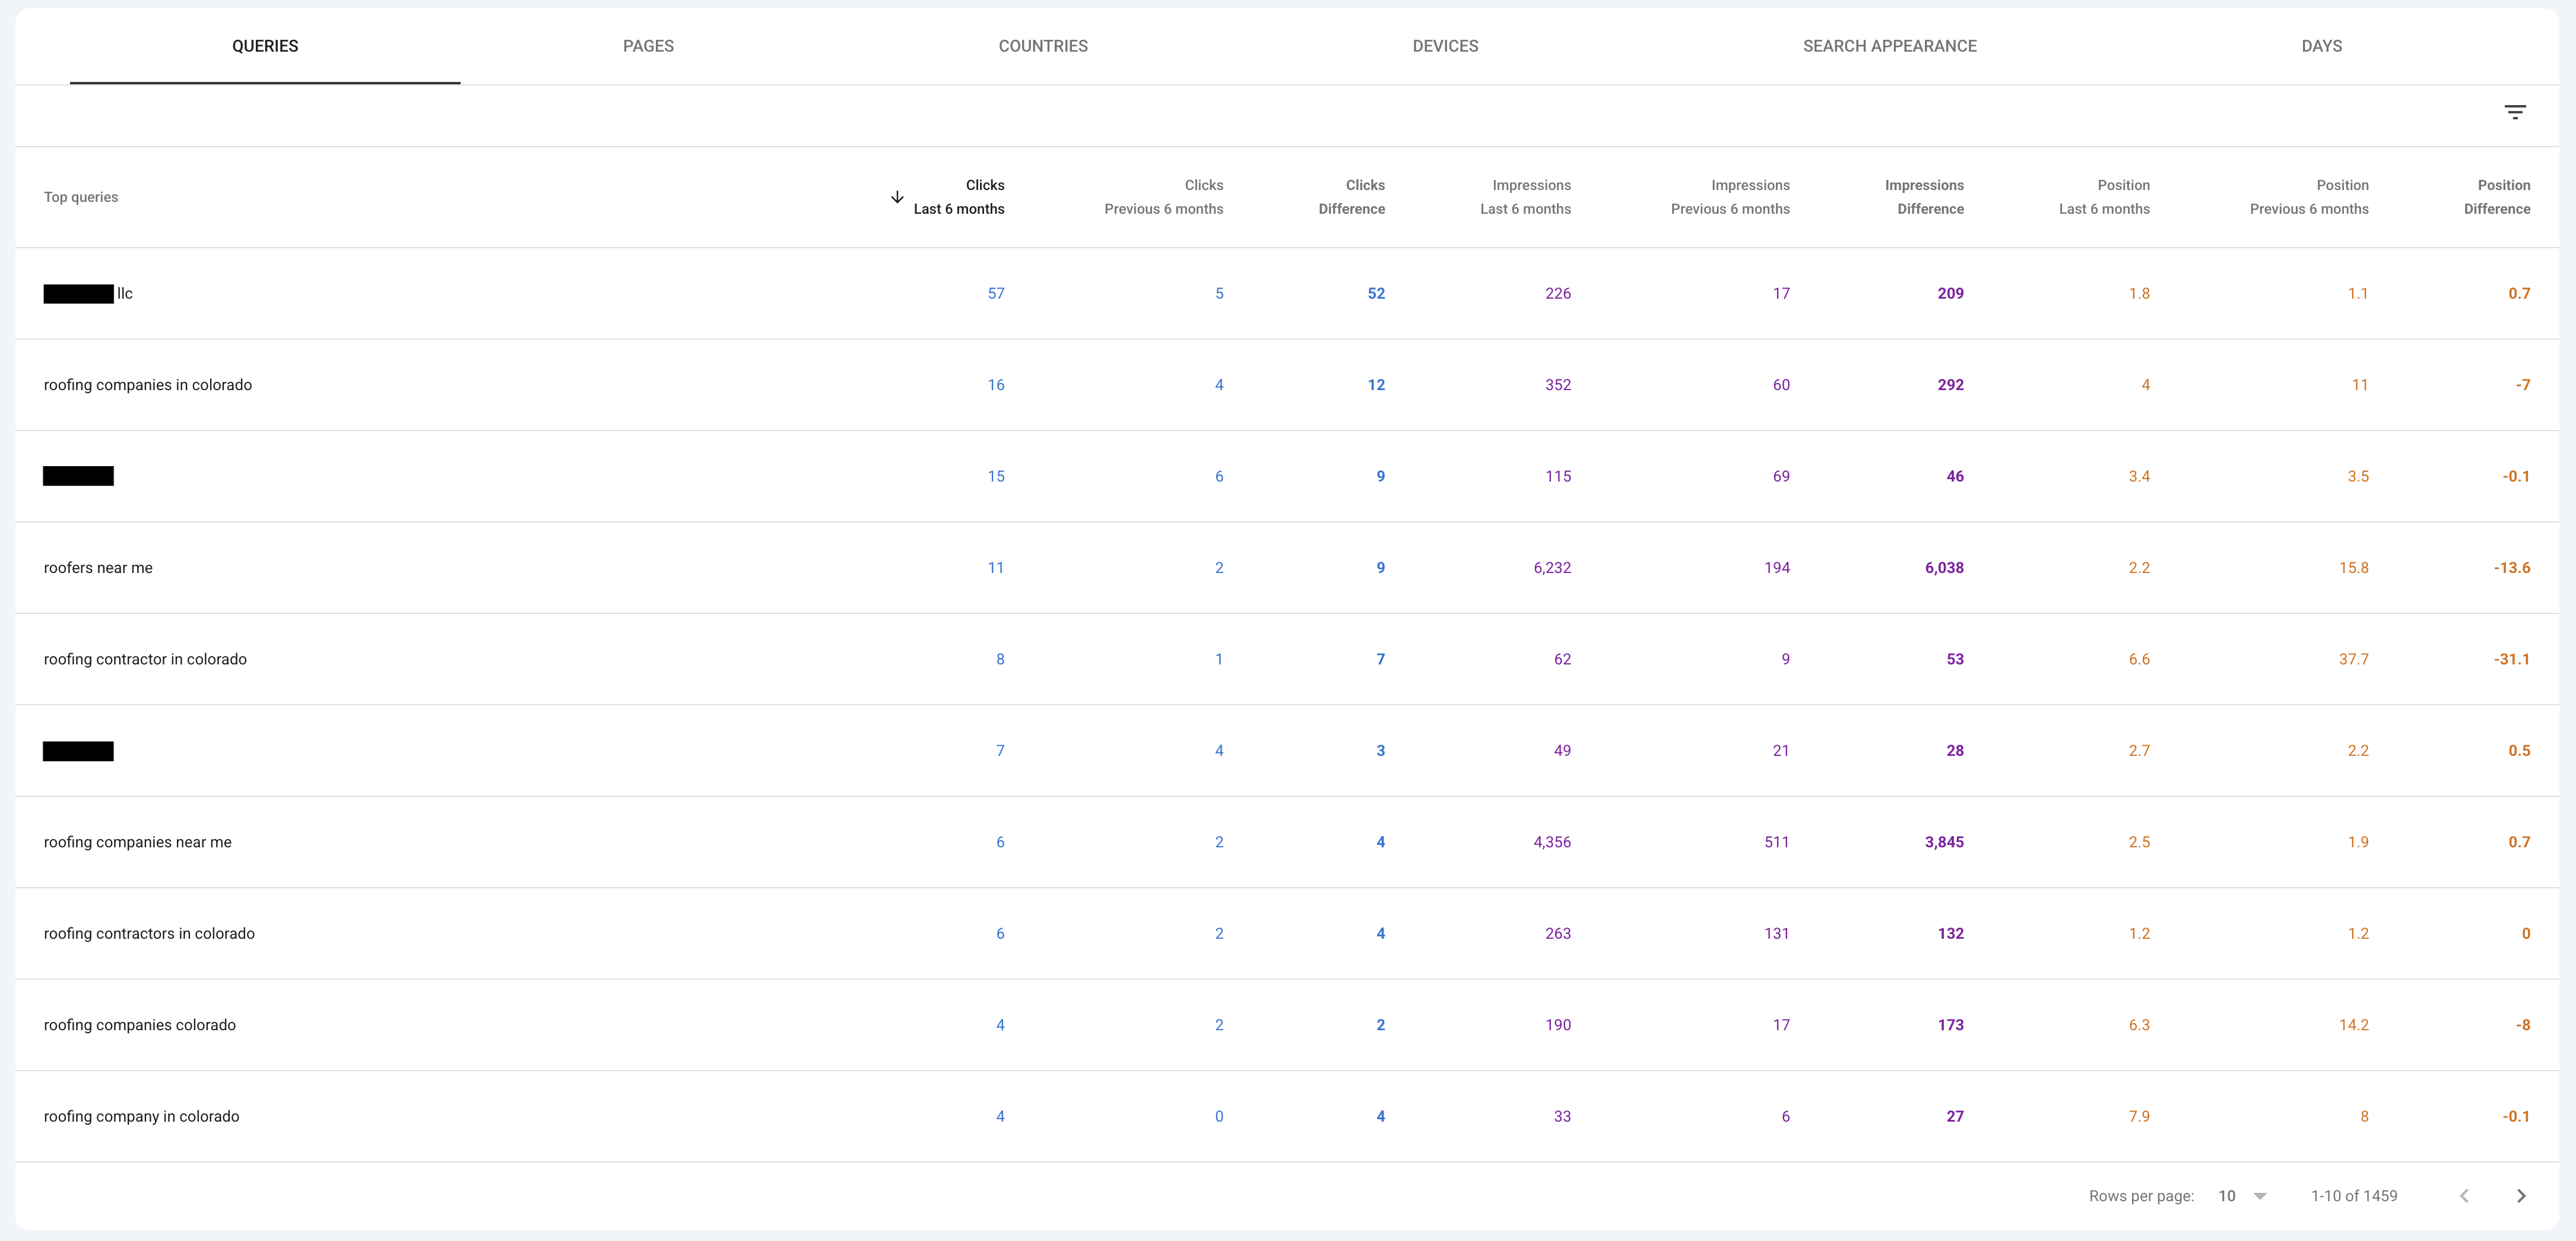
Query-Level Search Visibility
The query comparison shows that the website is being discovered across multiple roofing-intent searches, including localized contractor searches, broader Colorado roofing phrases, and “near me” variants. Query-level data helps identify where increased impressions are already turning into clicks and where a growing visibility footprint still has room to earn a higher click rate.
Google Search Console · Six-Month Query Comparison
Measurement note:
Google Maps search grids and Google Search Console measure different surfaces in Google. Grid rankings describe Google Business Profile visibility from specific locations; Search Console describes website impressions, clicks, click-through rate, and average organic position.
Roofing Search Intent
Parker's Local Search Gains Were Uneven—and That Is the Useful Part
The report does not show one generic “roofing ranking.” It shows a mature search term, a developing contractor term, and two additional phrases with very different local footprints. For an agency, those differences are more actionable than a single average.
“Roof Replacement Parker” Was a Defense-and-Expansion Term
Starting SoLV at 86.85 means the profile was already appearing in the top three across most of the 289-point grid. The August result did not need a dramatic rescue. The opportunity was to close weaker pockets and make the strong footprint more uniform. The move to SoLV 95.50 and ARP 1.45 reflects that kind of refinement.
This matters in roofing because a high-value service can justify protecting a strong local position even after the obvious ranking gains have already happened. Mature keywords still need monitoring because competitors, reviews, proximity, seasonal demand, and Google's local results continue changing.
“Parker Roofing Contractor” Was Still a Growth Term
The contractor query tells a different story. ARP moved from 5.19 to 4.47, which is useful but not enormous. SoLV, however, rose from 4.15 to 26.64. That means substantially more tested locations crossed into the top-three threshold even while the overall average remained just outside the Map Pack.
For strategy, this is a more interesting keyword than a simple “green grid” screenshot might suggest. It shows a term moving through the middle stage of local expansion: no longer weak everywhere, not yet dominant, and therefore still capable of producing visible gains from incremental improvements.
The Top-Three Threshold
A 6.4× Jump in Top-Three Coverage Is Different From “Owning the Map”
Share of Local Voice can change sharply when many grid points move from position 4 or 5 into positions 1–3. That creates a large visibility gain even if average rank changes by less than one full position.
That distinction is important in this Parker report. “Parker Roofing Contractor” gained 22.49 SoLV points, taking top-three coverage from 4.15 to 26.64. Relative to the starting point, that is roughly a 6.4× increase in Map Pack coverage. But an ARP of 4.47 still says the profile is commonly sitting near—but not consistently inside—the first three local results across the entire scan.
For a roofing client, this is a better conversation than simply saying rankings “went up.” The report can identify a concrete next objective: convert more of the yellow/orange middle positions into top-three visibility. That gives future reporting a defined threshold to watch and gives the SEO plan a direction beyond producing more pages or checking rankings at random.
It also explains why two local SEO metrics can appear to tell different stories without contradicting each other. Average position answers, “Where do we tend to rank?” Share of Local Voice answers, “How often are we actually in the first three?” A business can improve one faster than the other.
Website Search Expansion
The Roofing Website Is Earning a Much Larger Search Footprint
The Search Console comparison adds something the map grids cannot: evidence that the website itself is being shown for far more organic searches than it was in the previous six-month period.
Latest 6-Month Clicks348
Versus 90 in the previous six months.
Latest 6-Month Impressions166K
Versus 40.6K in the previous six months.
Average Position9.9
Improved from 16.3 in the previous period.
Clicks increased about 287%, while impressions increased about 309%. Average position improved by 6.4 positions. The CTR displayed in both six-month periods remained 0.2%, so the traffic gain was not driven by a higher percentage of searchers clicking each impression. The bigger change was reach: Google was showing the site much more often, and the site was ranking higher on average across the query set.
That creates a specific next-stage opportunity. Once a site earns substantially more impressions, titles, descriptions, page intent, rich-result eligibility, and ranking movement on high-impression queries become more valuable. A roofing site with 166,000 impressions has a larger pool of existing visibility to convert into clicks than one with 40,600 impressions—even before creating another new search impression.
Search Console also keeps the analysis grounded. It prevents an agency from assuming that better Map Pack grids automatically mean identical website growth. In this case, both surfaces show positive movement, but each is measured independently and should be optimized according to its own bottleneck.
Roofing Market Timing
Roofing SEO Has a Timing Problem: Demand Can Spike Before Rankings Catch Up
Roof replacement, contractor, roofer, storm, hail, and “near me” searches do not behave like one interchangeable keyword. A roofing business needs useful coverage before the exact demand spike arrives.
1
Protect the High-Intent Terms That Are Already Strong
“Roof Replacement Parker” and “Roofing Parker CO” show very broad local coverage. Those searches should not disappear from the reporting plan just because they look good today. They represent valuable demand that competitors are also trying to capture.
2
Build Depth Around Terms That Are Moving Toward the Map Pack
“Parker Roofing Contractor” is the clearest expansion opportunity in the matched comparisons. The profile is gaining top-three coverage, but the full-grid average still leaves a measurable gap between current visibility and broad Map Pack consistency.
3
Use Website Query Data to Prepare for Broader Demand
Search Console can reveal search themes before they become major traffic sources. For a seasonal industry, growing impressions across contractor, roofing-company, location, and “near me” terms creates a list of pages and SERP snippets worth improving before peak demand.
Why this angle matters:
Roofing demand can change quickly after severe weather, insurance activity, seasonal maintenance, or neighborhood replacement cycles. SEO work done only after a demand spike may be too late to capture the earliest searches. Building and measuring coverage in advance gives the business a better starting position when demand accelerates.
Turning Reporting Into Action
Use the Report to Build the Next Roofing SEO Work Queue
A client report is more useful when each metric can point to a different type of next action. This Parker data naturally separates into maintenance, expansion, and click-capture opportunities.
SoLV 95.50 for Roof Replacement ParkerMaintain
Protect local relevance, reviews, profile completeness, service-page quality, citations, and other signals supporting an already strong footprint.
SoLV 26.64 for Parker Roofing ContractorExpand
Watch the positions hovering just outside the top three and reinforce the contractor/service theme where the profile still has geographic gaps.
166K website impressions at 0.2% CTRCapture More Clicks
Prioritize high-impression queries and pages where better ranking position, titles, descriptions, content alignment, or SERP presentation could turn existing visibility into more visits.
Average position improved from 16.3 to 9.9Push Near-Winners
Identify queries and pages sitting near the first-page threshold and concentrate internal linking, topical support, on-page refinement, and authority work where a smaller ranking gain can materially change exposure.
This creates a more credible client conversation than “we did SEO this month.” One part of the campaign is defending strong local visibility. Another is moving a weaker contractor query into more top-three positions. A third is converting a rapidly expanding website impression base into more organic clicks.
For agencies, that separation is also useful for retention. The client can see that the next month's work is not arbitrary: it follows directly from the measured gaps in the report. When the same categories are reviewed again, the agency can show whether the work queue addressed the intended bottleneck.
Parker Roofing SEO FAQ
Questions Raised by This Roofing Search Report
These answers focus on the specific patterns in this report: two matched local-search comparisons, two additional roofing queries, and website visibility that expanded much faster than click-through rate.
What improved most between the June and August Parker roofing grids?
The biggest relative change was Share of Local Voice for “Parker Roofing Contractor,” which increased from 4.15 to 26.64. “Roof Replacement Parker” was already strong and improved from 86.85 to 95.50 SoLV while its ARP improved from 2.08 to 1.45.
Why is the jump from 4.15 to 26.64 SoLV important if ARP is still 4.47?
The metrics answer different questions. ARP summarizes average ranking position, while SoLV measures how often the profile reaches positions 1–3. A SoLV jump can therefore show many locations crossing the Map Pack threshold even while the average across all grid points remains above position three.
Can “Roofing Parker CO” and “Parker Roofers” be compared as a ranking change?
No. They are different search terms and were scanned on different dates. Their screenshots are useful for understanding keyword-specific visibility, but they should not be presented as a before-and-after test of the same query.
What does 348 clicks versus 90 clicks tell us about the roofing website?
The latest six-month Search Console period generated 258 more organic clicks, or roughly 287% growth. Because impressions also increased sharply—from 40.6K to 166K—the site was being shown in substantially more searches, not merely earning a higher click rate from the same visibility.
Why did clicks grow if Search Console CTR stayed at 0.2%?
The site received far more impressions. A similar percentage applied to a much larger impression base can still produce many more clicks. This also exposes the next opportunity: improving rankings and search-result presentation on high-impression queries may help the site capture more traffic from visibility it already has.
What does average position improving from 16.3 to 9.9 mean?
It means the site's average Search Console position across the measured query set improved by 6.4 positions in the latest comparison period. It does not mean every keyword ranked 9.9 or that every result was on page one; Search Console averages many queries, pages, locations, and impressions together.
Do strong Google Maps rankings mean the roofing website ranks equally well?
No. Google Business Profile results and website organic results are separate search surfaces. The grid screenshots measure local profile placement from map points, while Search Console measures the website's organic impressions, clicks, CTR, and average position.
What would be a sensible next measurement cycle for this roofing campaign?
Re-run the matched grid terms with the same center, grid size, radius, and keywords so the local comparisons remain consistent. In Search Console, continue using comparable date windows and review high-impression queries, pages near stronger ranking thresholds, and changes in clicks and CTR rather than relying on one aggregate metric.
See How Different Search Signals Build a More Useful SEO Story
Explore additional GHL Meets SEO case studies to see how local rankings, website search data, paid acquisition, and client reporting can be combined differently depending on the business and the question the report needs to answer.
Josh Cline is the
creator of GHL Meets SEO, co-owner of Customers.Plus,
and the author behind the educational content on this site.
He has spent the last six years working hands-on with
HighLevel, websites, on-page and local SEO, Google Ads,
automation, content production, and conversion tracking
across real client accounts. More than 550 HighLevel
agencies use his courses and snapshots, while his own
agency remains the testing ground for the systems,
workflows, and reporting he shares here.
550+ HighLevel Agencies
6 Years Hands-On
15+ Client Niches